
F. WEIN
92
Statistical method
IBM SPSS Statistics software was used for
the statistical analysis. A
Chi2
test was used
to compare the qualitative data and Kruskall-
Wallis and Mann/Whitney tests to compare
the quantitative data. The alpha threshold
was 5%.
RESULTS
Pre-surgical features of the two
populations
The Rigid Population was composed of 37
patients: 25 men (67%) and 12 women (33%);
the Flexible Population was composed of
43 patients: 29 men (67%) and 14 women
(33%). These two populations were considered
comparable in terms of numbers (
p
=0.6) and
gender (
p
=0.8).
The mean height of individuals in the Rigid
Population group was 174cm [162-190]; the
mean height of individuals in the Flexible
Population group was 176cm [158-194]. These
two populations were considered comparable
in terms of height (
p
=0.8).
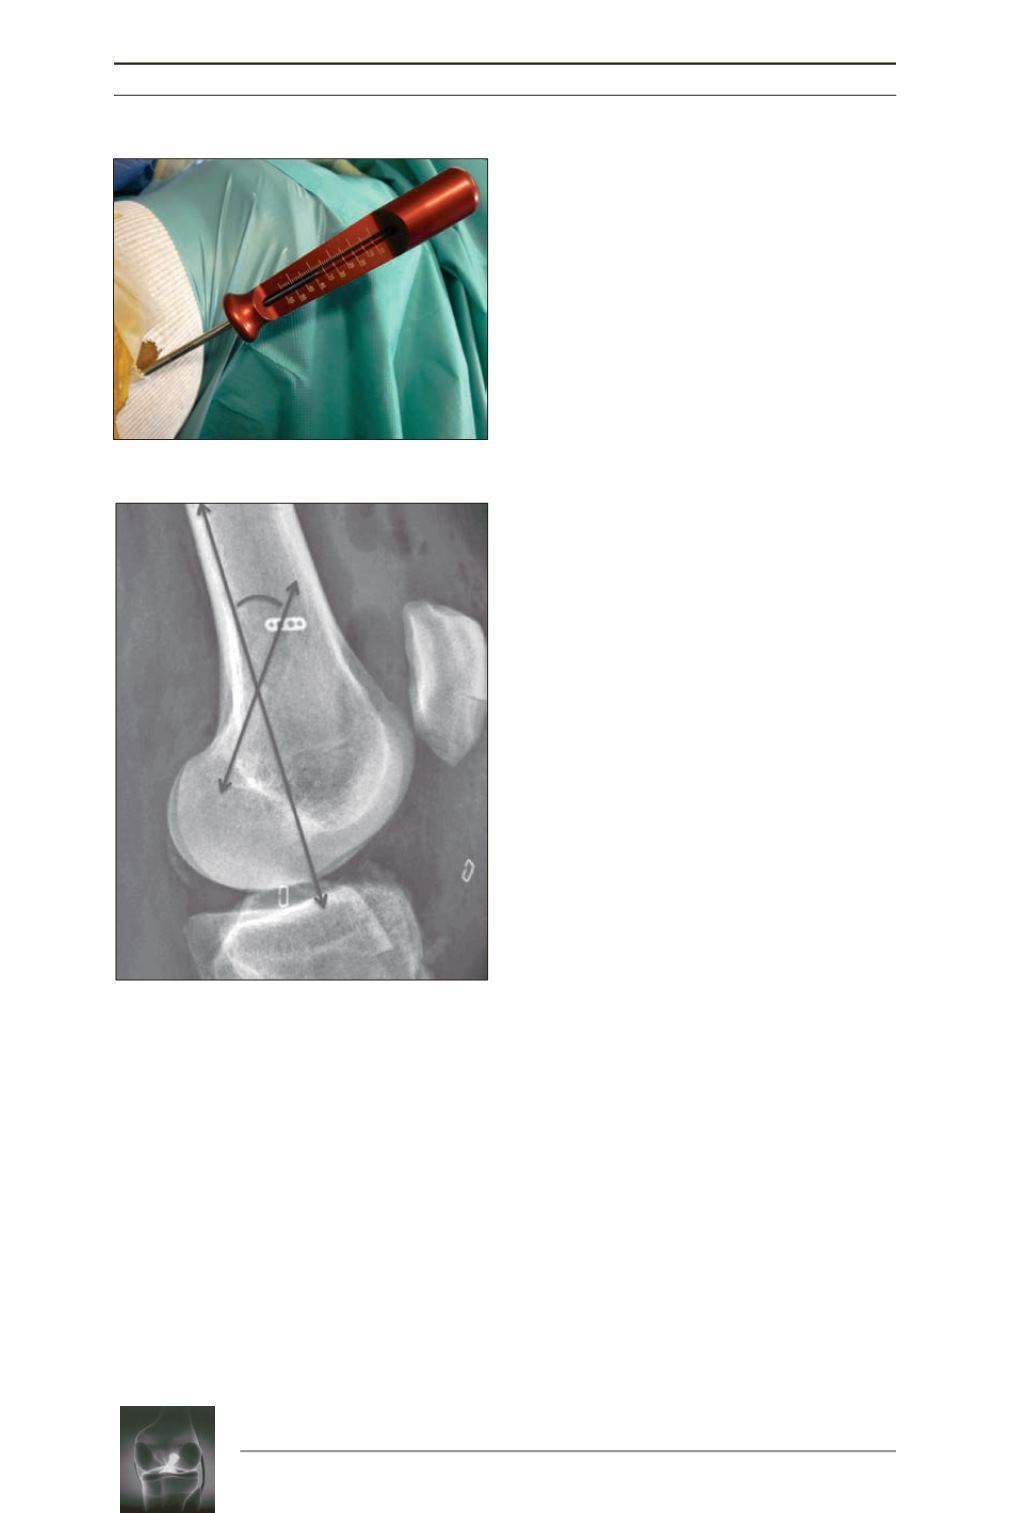
Length and anteversion of the
femoral tunnel
The length of the femoral tunnel in the Rigid
Population was 34mm [25-45]; its mean length
was 41mm [35-50] in the Flexible Population;
this difference was considered as significant
(
p
=0.0001).
The mean anteversion of the femoral tunnel in
the Rigid Population was 20° [5-25]; it was 40°
[35-45] in the Flexible population; this
difference was considered as significant
(
p
=0.0001) (fig. 5 and 6).
Fig. 3:
Femoral tunnel measure
Fig. 4:
Anteversion measure


