
R. Bastos-Filho, P. Neyret
158
Data Collection
For each procedure, data collected prospectively
from the TKA registry were obtained
retrospectively. Data collected included the pre-
TKA and final follow-up International Knee
Society (IKS) score [17] and the pre-TKA Hip-
Knee-Ankle (HKA) angle. The delay in months
between osteotomy and TKA was determined
in both groups. Furthermore, we analyzed the
relationship between patient age at the time of
HTO and the survivorship of this surgery. The
HKA angle was obtained from full-length,
weight-bearing radiographs in all cases.
Statistics
The S-Plus 8.0 software was used for statistical
analysis. A two-independent-samples Student’s
t
-test was used to compare the mean time
between surgeries for each type of osteotomy.
Spearman’s rank correlation was used to
evaluate the linear association between
osteotomy and TKA delay and age at the first
surgery. Cox proportional hazards regression
was used to analyze the association between
the type of osteotomy and the risk of TKA. A
p
-value of 0.05 was considered to indicate
statistical significance. Sample means, standard
deviations, and ranges were calculated for
continuous variables. Because the data were
normally distributed,
t
-tests were used to
compare the means of continuous variables
between the two osteotomy groups. Fisher’s
exact test was used to compare nominal and
categorical variables.
Results
Twenty-four knees (17%) had undergone prior
medial opening-wedge HTO, and 117 (83%)
had undergone prior lateral closing-wedge
osteotomy. Fifty-seven (48.3%) patients were
female, and 61 (51.4%) were male. The mean
age at the time of the osteotomies was 55.0 ±
9.4 years (range, 22.0-69.0 years), and the
mean time from HTO to TKA was 12.2 ±
6.3 years (range, 1.5-34.4 years). The mean
patient age at the time of TKA was 67.2 years.
The mean pre-TKA IKS knee and function
scores were 54.0 ± 16.5 and 60.3 ± 18.3,
respectively. The mean pre-TKA HKA angle
was 179.5 ± 6.2 degrees (range, 162-197
degrees). At the time of TKA, 68 (48.2%) knees
had valgus alignment and 73 (51.8%) had varus
alignment. No significant differences between
the medial opening-wedge group and lateral
closing-wedge group were noted among the
pre-TKA measurements, with the exception of
the time from HTO to TKA, which was
significantly longer in the closing-wedge HTO
group (Table 1).
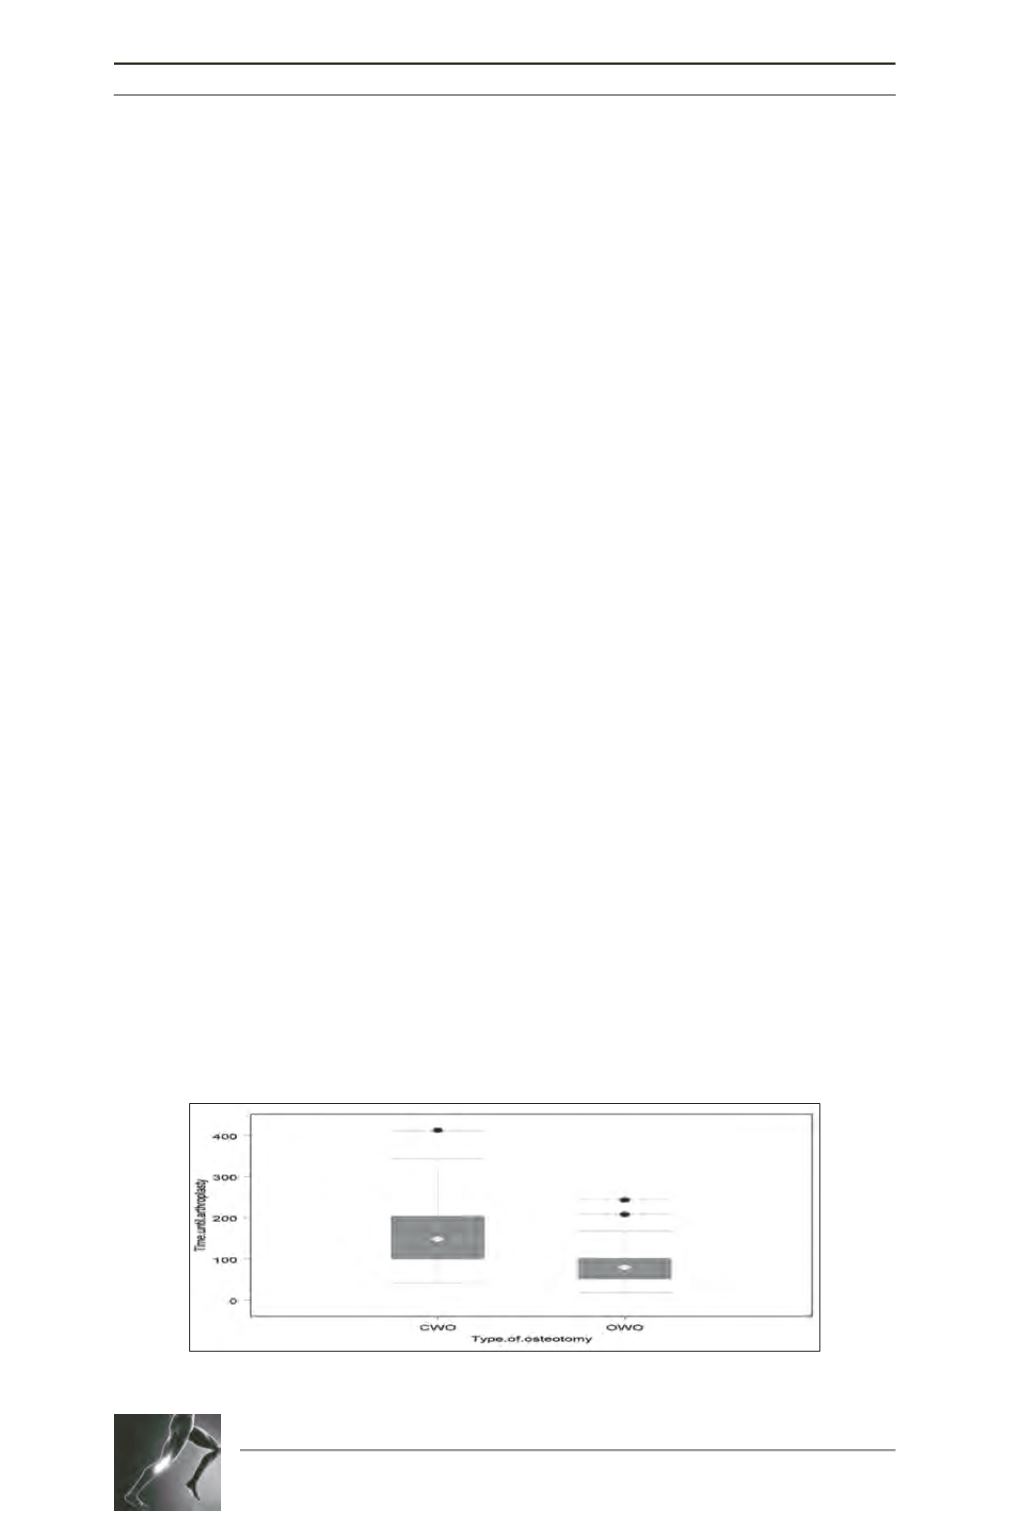
In the CWO and OWO groups, the mean time
before TKA was 146.3 months (range, 18.0-
413.0 months; SD, 76.3).
The t-test results showed a significant difference
in delay between the CWO and OWO groups
(p < 0.0001) (Table 2). In the OWO group, the
mean time before TKA was 88.6 months
(median, 80.0; range, 18.0-253.0; SD, 56.5). In
the CWO group, the mean time before TKA
was 158.5 months (median, 148.5; range, 40.0-
413.0; SD, 74.5) (fig. 1).
Fig. 1: Box plot showing delay between surgeries according to type of osteotomy.


