
High Tibial Osteotomy Survivorship: Opening- versus Closing-wedge
159
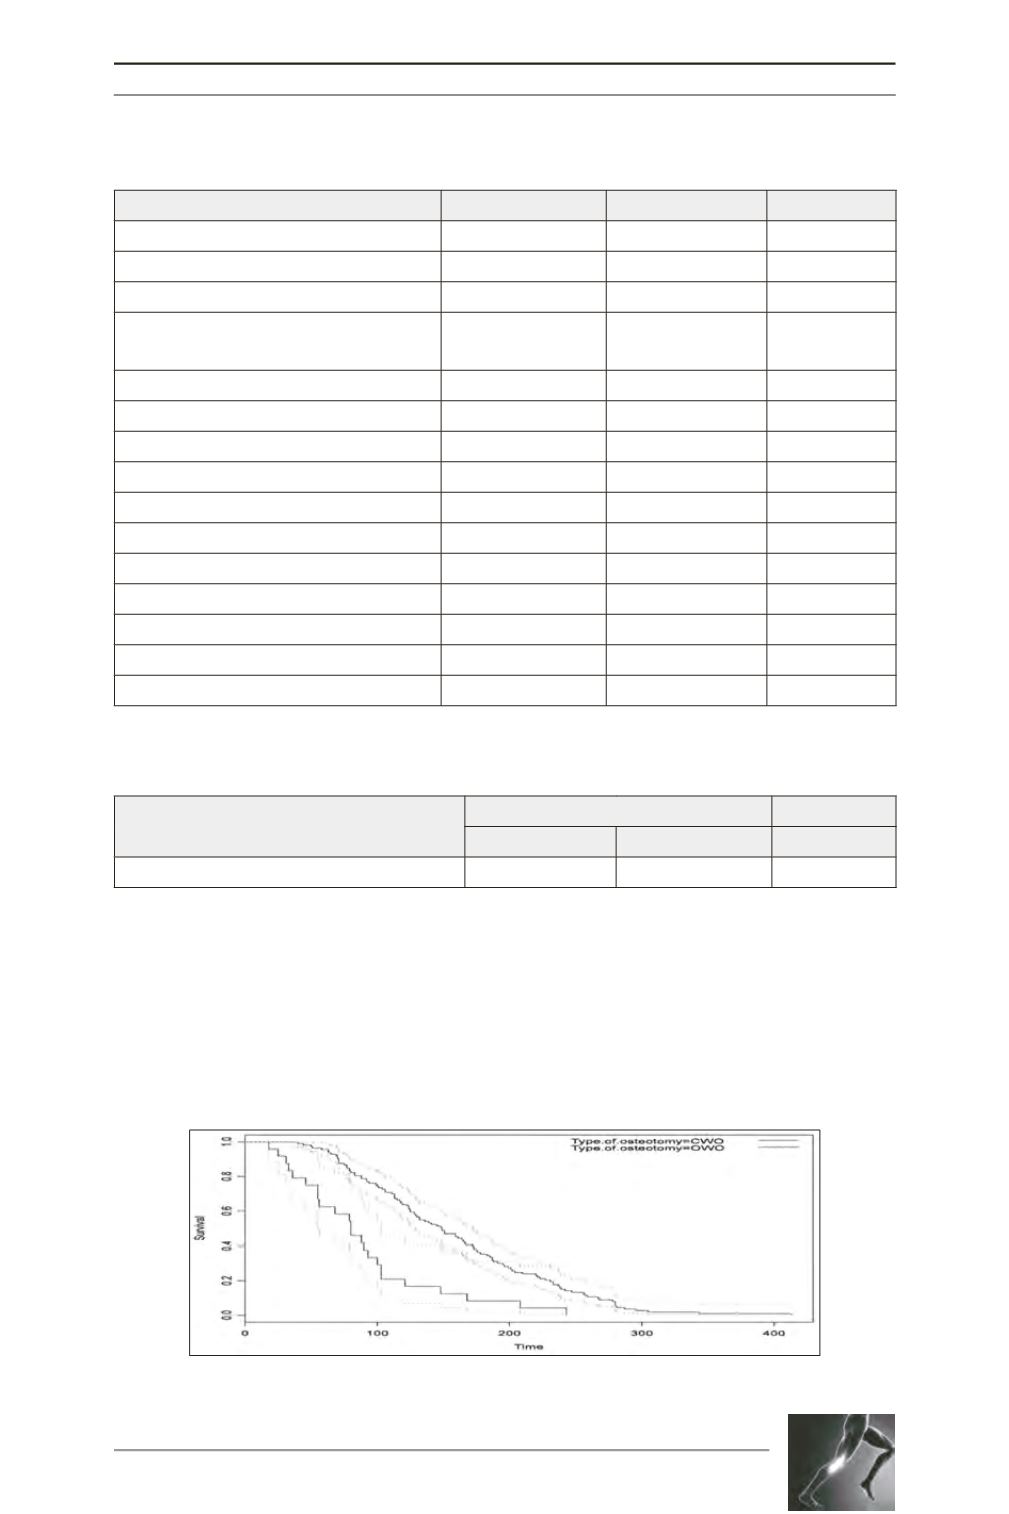
Figure 2 Presents the survival curves for each
of the two types of osteotomy. Patients who
underwent OWO had a greater probability of
undergoing TKA within a certain period of
time. The performance of TKA after OWO was
almost threefold more frequent (RR=2.91) than
that after CWO, and this difference was
statistically significant (p=0.0000042). These
results were confirmed by performing the log-
rank test, which showed that the survival curves
of patients undergoing OWO and CWO were
significantly different (p=0.00000151).
Table 1: Pre-TKA Comparison of the Opening- and Closing-wedge Groups.
Opening (n = 24) Closing (n = 117) Significance
Age at time of HTO (years)
57.3 ± 7.0
54.5 ± 9.7
p = 0.18
Time from HTO to TKA (years)
7.4 ± 4.7
13.2 ± 6.2
p < 0.0001
Age at time of TKA (years)
64.3 ± 7.6
67.8 ± 9.8
p = 0.10
Sex (percent male)
16/24
(66.7%)
60/117
(51.3%)
p = 0.18
Weight (kg)
80.0 ± 15.1
82.3 ± 16.9
Body mass index (kg/m2)
27.8 ± 5.1
29.4 ± 5.2
Patella height (Blackburn–Peele index)
0.79 ± 0.22
0.79 ± 0.32
p = 1.0
IKS Knee Score
56.3 ± 13.6
53.6 ± 16.8
p = 0.40
IKS Function Score
59.4 ± 15.1
60.5 ± 18.6
p = 0.78
Mean Hip-Knee-Ankle angle (degrees)
178.5 ± 6.1
179.7 ± 6.3
p = 0.41
Limb alignment
p = 0.41
- Varus
14 (58.3%)
59 (50.4%)
- Valgus
10 (41.7%)
58 (49.6%)
Extension deficit (degrees)
2.1 ± 4.8
3.1 ± 5.3
p = 0.39
Flexion (degrees)
119.8 ± 14.0
112.7 ± 16.5
p = 0.06
Table 2: Delay from CWO and OWO to TKA (t-test)
Type of osteotomy
OWO
CWO
p-value
Delay between HTO and TKA (months)
88.62 (56.55)
158.55 (74.51)
0.0001
Fig. 2:
Hazard regression showing risk of TKA according to type of osteotomy.


