


 168 / 324

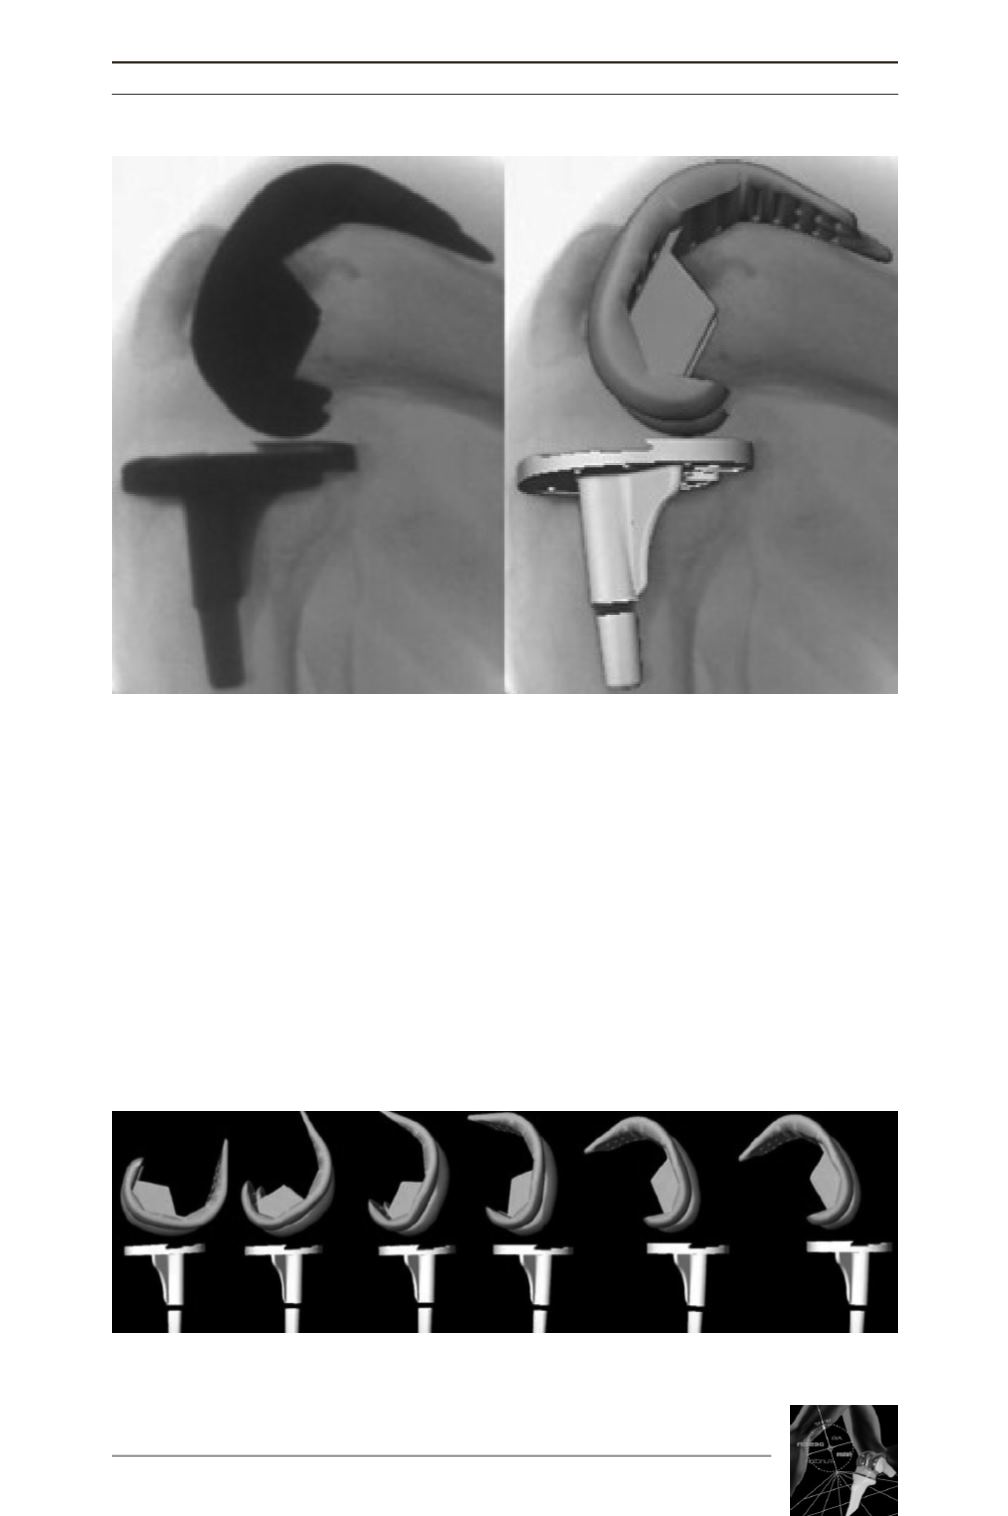
The prosthetic geometry will as such influence
the way the kinematic pattern is presented by its
tibiofemoral contact points. As shown in figure
3, the initial motion arc from full extension to
30° of flexion will induce a much greater trans-
lation of the tibiofemoral contact points than the
motion arc between 100° and 130° flexion, due
to the ‘flatter’ nature of the femoral prosthetic
component in its most caudal aspect as compa-
red to its posterior aspect (fig. 3). Consequently
direct comparison of graphs obtained from the
native knee with graphs obtained from the pros-
thetic knee is not possible, unless the same
methodology for studying and reporting the
kinematic pattern is used. We recently publi-
shed on an experimental model allowing the
comparative study of the native knee with the
prosthetic knee [19]. This model allows for a
direct comparison between the native and pros-
thetic setting and provides information to ans-
wer the following questions that are commonly
asked regarding this subject.
COMPARATIVE KINEMATICS BETWEEN THE NATIVE KNEE AND TOTAL KNEE ARTHROPLASTY
167
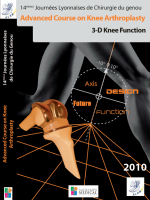
Fig. 2 : A model fitting technique based upon fluoroscopic imaging allows for kinematic
description of the prosthetic knee. Contact points are derived indirectly from the relative
distance between tibia and femur.
Fig. 3 : Graphical representation of sequential relative
tibiofemoral position during the flexion arc.