
parameters, maximum flexion angle and
moments during gait. The activities included
level walking at a “self-selected” speed, rising
and sitting in to a chair, ascending and
descending three stairs a “self-selected” speed.
Data was captured at 120Hz and analyzed
using Bodybuilder software. Relevant outputs
were then transferred onto Excel spreadsheets
for further analysis. Statistical analysis was
performed using SPSS version 14.0.
RESULTS
Clinical functional results
Oxford score, Maximum flexion, FFC (Fixed
Flexion Contracture) (table II).
Temporospatial data
Walking speed, cadence, single stance support
time and percentage of swing phase were ana-
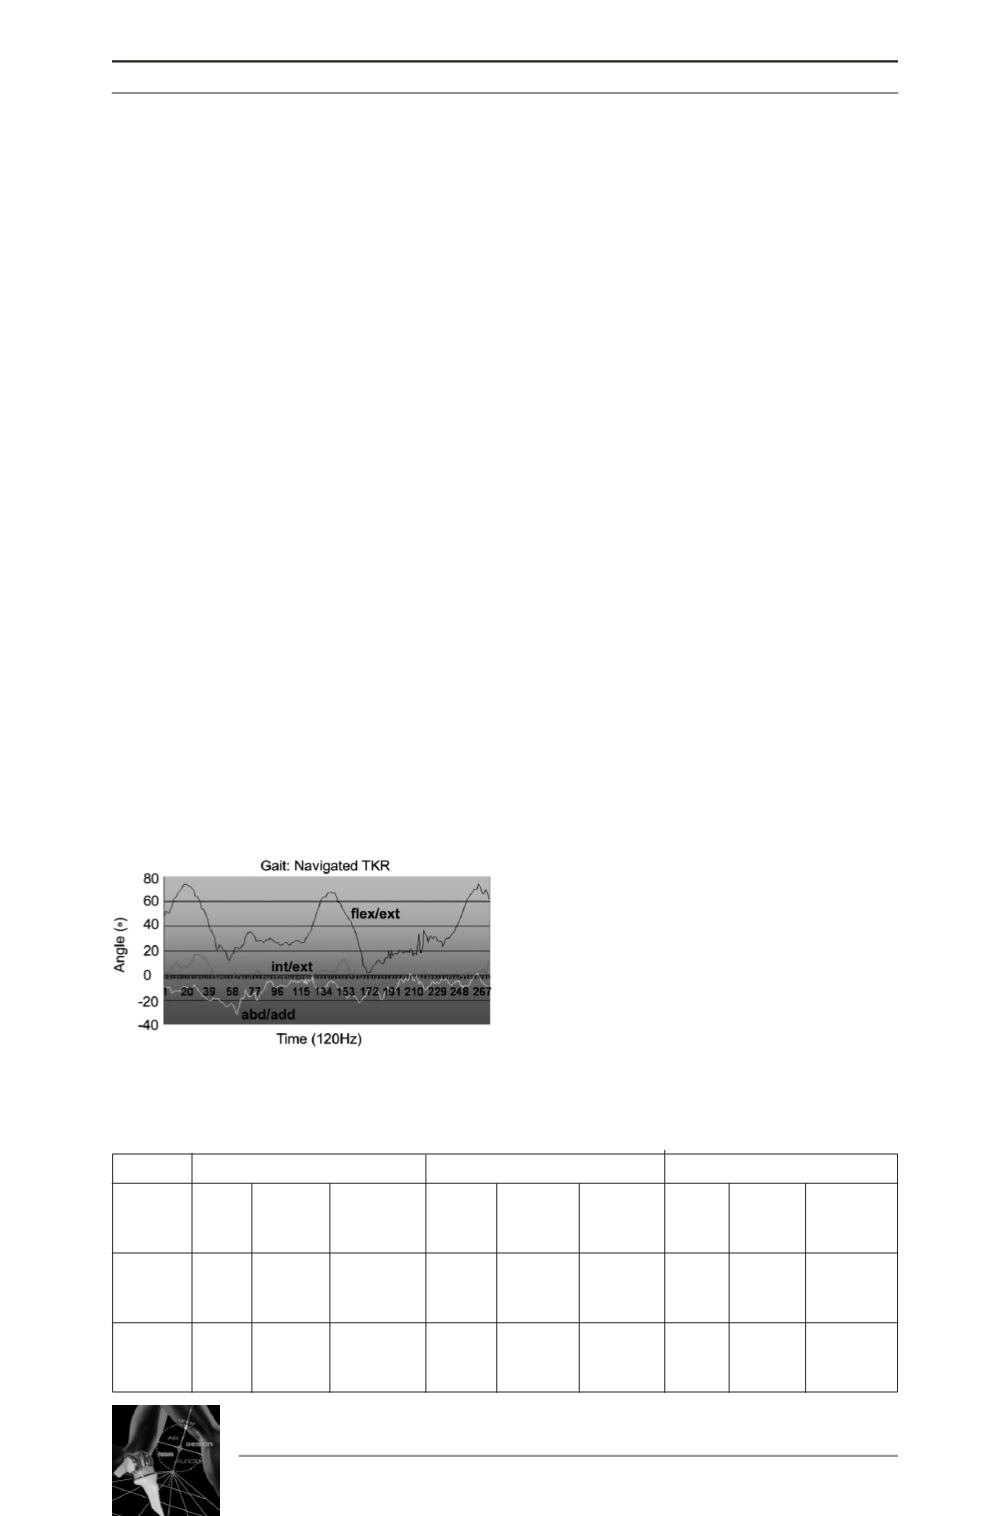
lyzed. Normal walking pattern from control
group featured a biphasique moment pattern
which was detected in 80% of navigated sub-
jects compared to 45% of standard subjects.
(Fig. 3: biphasique walking pattern.)
In the control group double stance support was
60% of the gait cycle while 40% was the
swing phase which is usual feature in normal
gait. Double stance support last 12% of the
gait cycle twice in complete cycle starting
from right foot to right foot again. Mean dou-
ble stance support time was greater in the stan-
dard group (17% of gait cycle compared to
15.5% in the navigated group). (p<0.05).
ANOVA was performed, with significance set
at p<0.05.
Adduction moment
Gait moment was measured by ground reaction
force plate-form during walking cycle at the
full load of the operated leg between 0 and 15%
of cycle. Control group demonstrated a gait
moment of 0.4 Nm/kg (normal). Comparison
between navigated knees (0.34 Nm/kg) and
standard knees (0.30 Nm/kg) showed statistical
differences (p<0.05)
Maximum knee flexion
Double-stance support time and moments
were compared for gait in each group.
Maximum flexion angles were compared for
the standard group to controls and for the nav-
igated group to controls during gait, chair ris-
ing/sitting, stairs ascent and stairs descent.
Maximum knee flexion angles for both navi-
gated and standard TKA was less than for the
control group. However, the navigated group
achieved a greater mean maximum flexion
angle than the standard group, which was sim-
ilar to the control group when performing a
variety of normal daily activities (table III).
14
es
JOURNÉES LYONNAISES DE CHIRURGIE DU GENOU
252
Preoperative
6 weeks postoperative
One year postoperative
Clinical
Oxford Maximum Fixed
Oxford Maximum Flexion Oxford Maximum Fixed
Outcomes Score Flexion Flexion
Score
Flexion
Fixed
Score Flexion Flexion
Contracture
Contracture
Contracture
40.1
98
5
28 (5.5)
91
6
26 (9.0) 100 (15.3)
1
Standard
(5.2)
(21.2)
(5.3)
15-38
(13.9)
(5.7)
13-42 65-125
(1.5)
32-49
60-100
0-12
60-108
0-18
0.5
42.6
105
4
30 (7.5)
93
3
26 (5.3)
97
0
Navigation
(7.0)
(8.3)
(4.2)
18-44
(12.7)
(5.7)
17-35
(8.9)
(2.5)
32-52
90-120
0-10
65-110
+5-20
80-110
+ 10-5
Table II: Comparison between standard and navigated knees after 6 weeks and one year
Fig. 3: Biphasique moment


