


 75 / 324

Then the differences between c_pre and c_pre
calc, c_post and c_post calc and c_post and
c_predictive were calculated (Table 1). Pre
always defines the preoperative values, post
always defines the postoperative values, calc
defines the calculated values.
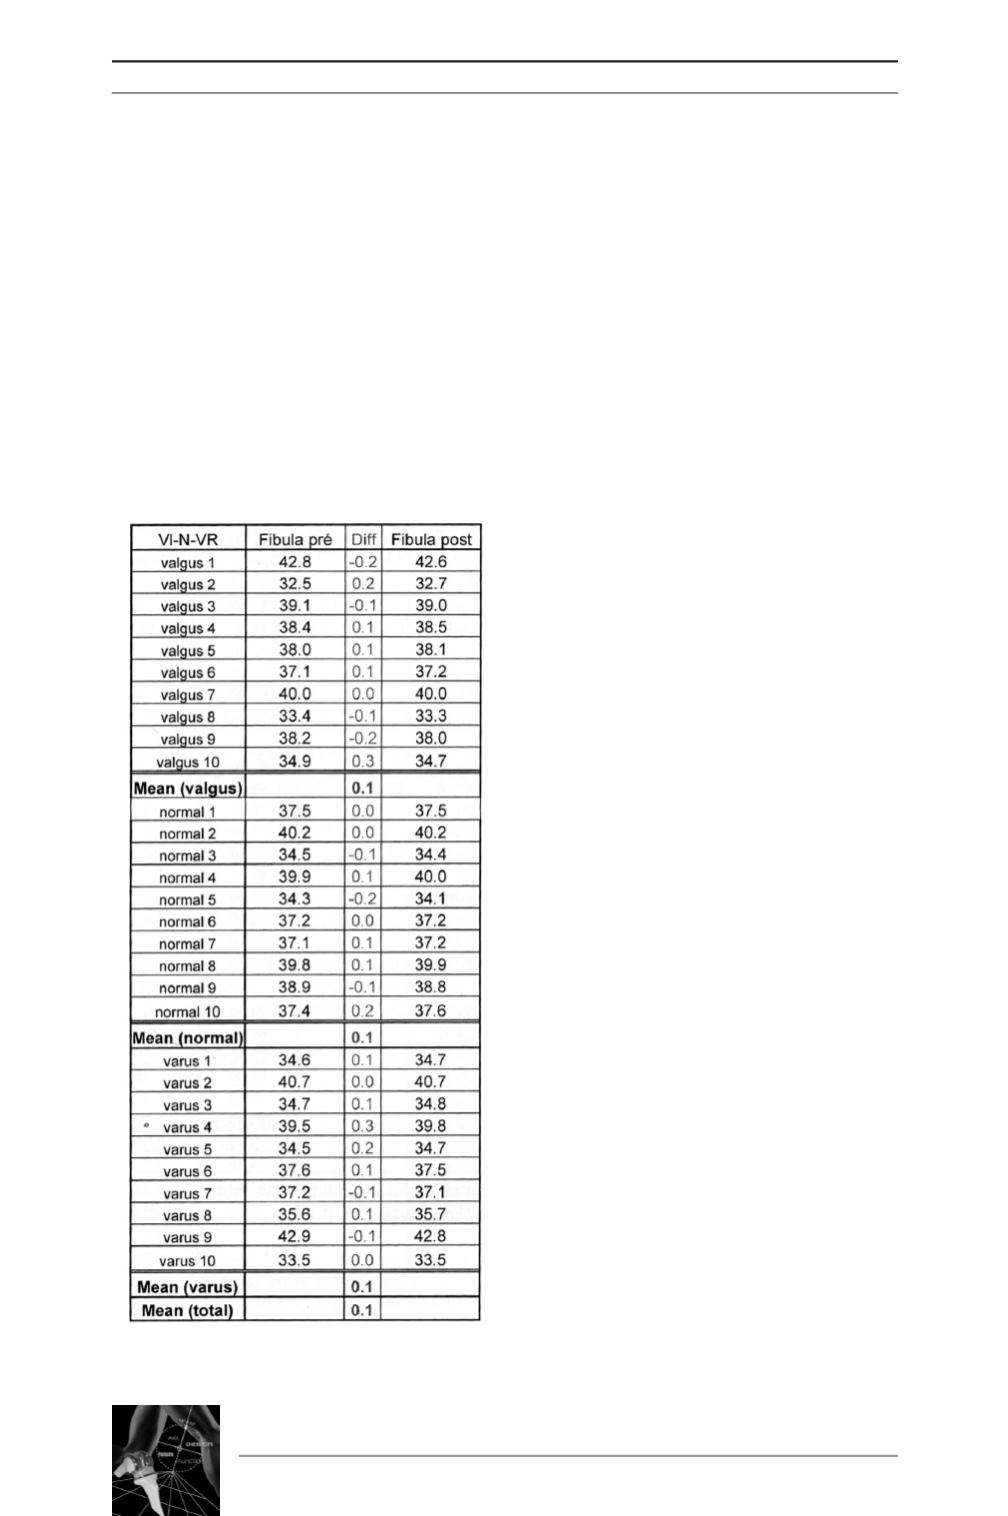
To assure consistent magnification between
radiographs we measured the fibula length on
the pre and postoperative radiographs. In two
cases we measured a difference of 3 mm, in
6 cases a difference of 2 mm, in 16 cases a dif-
ference of 1 mm and in 6 cases we had an
exact match (Table 2).
RESULTS
We first calculated the average length of a_pre,
a_post, b_pre, b_post, c_pre, and c_pre calc.
Here we could see that overall we had no leng-
thening in a and only a mean lengthening of
1 mm in b (Table 3). Having no mean diffe-
rence between c_pre and c_pre calc shows us
that we had measured a_pre, b_pre and the
angle gamma quiet exactly.
Taking the average length of a and b and assu-
ming gamma 195° we then calculated c_pre
calc = 80.5 cm as the average leg length c.
Then c_predictive was calculated with
γ
180°
and the average length of a and b preoperative.
The predicted length was 81.2 cm. This result
shows a lengthening of 0.7 cm for an average
long leg and a correction of 15°.
We then calculated all the differences between
the preoperative and postoperative measure-
ments as well as the differences between
c_post and c_post calc and finally between
c_post and c_predictive (Table 1). The small
differences between c_post and c_post calc
again show the accuracy of the measurements.
In one case there was a difference of 3 mm, in
all other cases the difference was 2 mm or less.
Then we compared the difference between
c_pre and c_post in the three groups (Table 1).
Group 1 (valgus)
In group 1 (valgus) we had a mean difference of
1.2 cm between c_pre and c_post. The smallest
difference was 0.3 cm the greatest difference
was 2.2 cm. Then we compared the measured
leg length c_post with the predicted leg length
c_predictive. In 6 cases our prediction was cor-
rect if we allow a tolerance of 0.5 cm. One case,
valgus 7 had a difference of 0.3 cm, two cases,
valgus 1 and valgus 4, had a difference of
0.2 cm, valgus 6 had a difference of 0.1 cm and
valgus 3 showed a exact match. In the remai-
ning valgus cases we had a difference of 0.8 cm
in one case, 1 cm in two cases and 1.8 cm in one
case (Table 1). Now we analyzed why c_post
and c_predictiv diverged in these cases.
14
es
JOURNÉES LYONNAISES DE CHIRURGIE DU GENOU
74
Table 2: Fibula length on preoperative
and postoperative radiographs. All mea-
surements are given in cm.