


 77 / 324

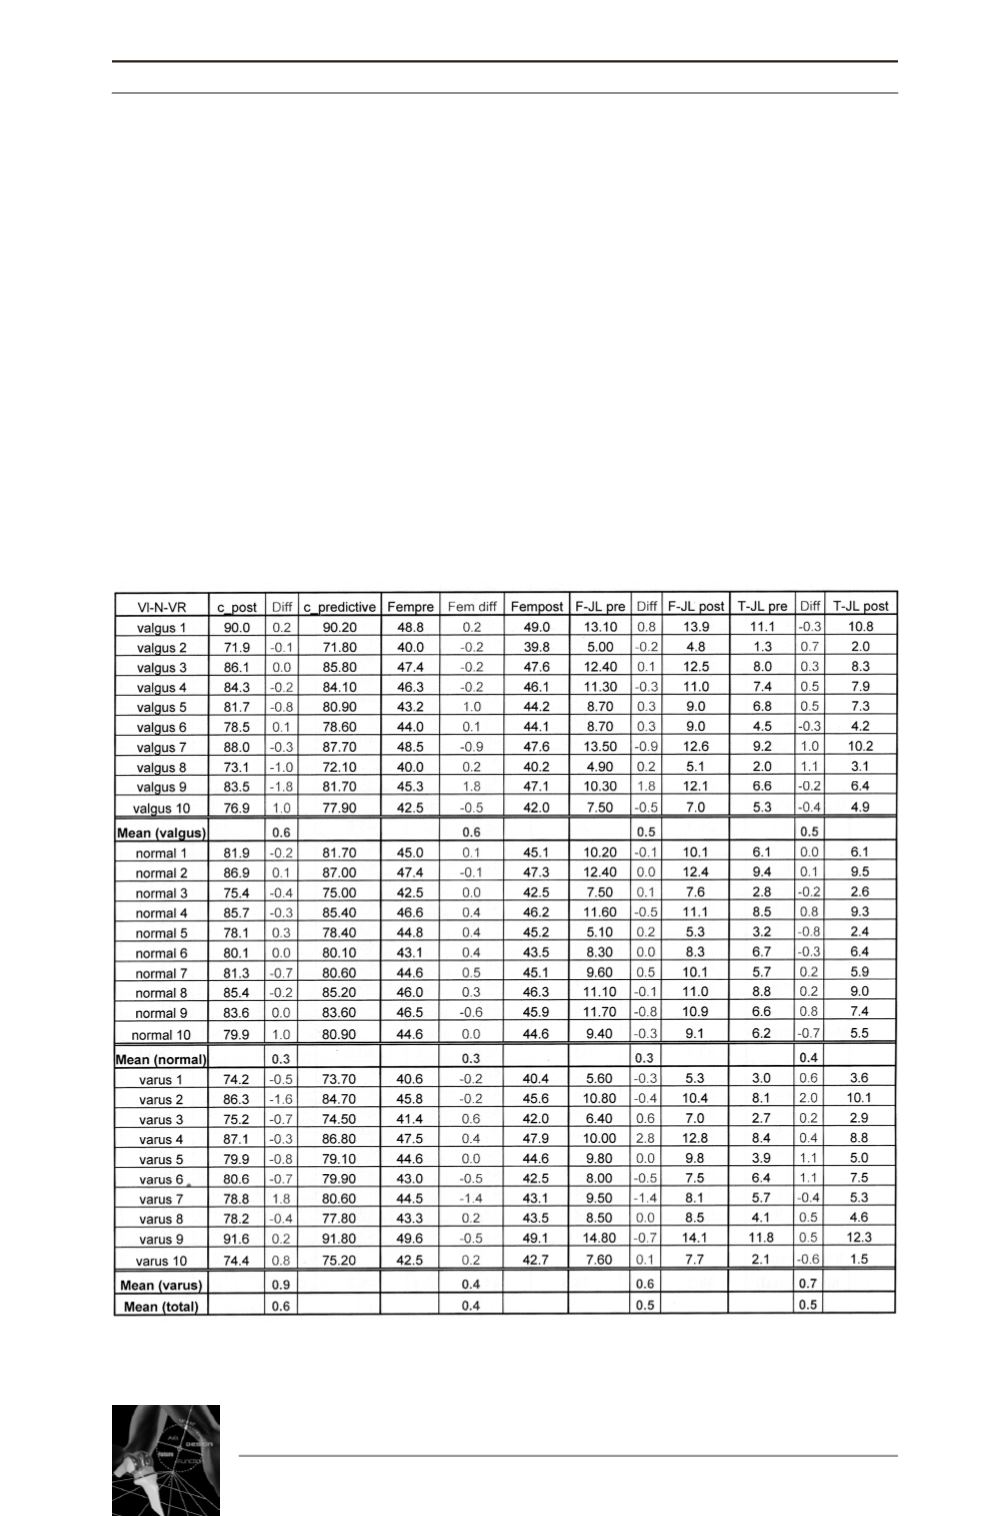
In case valgus 10 c_post was 1 cm shorter than
predicted and 0.3 mm shorter than preoperati-
ve. Here we could measure a shortening of the
femur of 0.5 cm plus a shortening of the tibia
(T-JL) of 0.4 cm which add up to a shortening
of 0.9 cm. This can also be measured as a shor-
tening of the knee joint of 0.9 cm.
The angle was overcorrected in to a varus of
10° considering an AFTm of 180° we would
predict a leg length of 77.1 cm which would be
0.8 cm shorter than c_predictive and which
would correspond with the measured shorte-
nings in leg length of 1 cm or knee length of
0.9 cm (Table 4).
Group 2 (normal)
In group 2 (normal) we calculated a mean dif-
ference of 0.3 mm between c_pre and c_post.
In 8 cases the difference of c_post to
c_predictive was 0.4 cm or less. The smallest
difference was 0 cm the largest 1.1 cm. In one
case, normal 7 c_post was 0.7 cm longer than
predicted. Here we could measure a lengthe-
ning of the femur of 0.5 cm and a lengthening
of the tibia (T-JL) of 0.1 cm. These add up to
0.6 cm and this matches with the lengthening
of 6 mm measured in the knee joint (Table 4).
In case normal 10 we had a shortening of 1 cm
to the predicted leg length c_predictive and a
14
es
JOURNÉES LYONNAISES DE CHIRURGIE DU GENOU
76
Table 4: Preoperativ and postoperative length of femur and “joint”.
All measurements are given in cm.