
Magnetic Resonance Imaging in Patellofemoral Instability
399
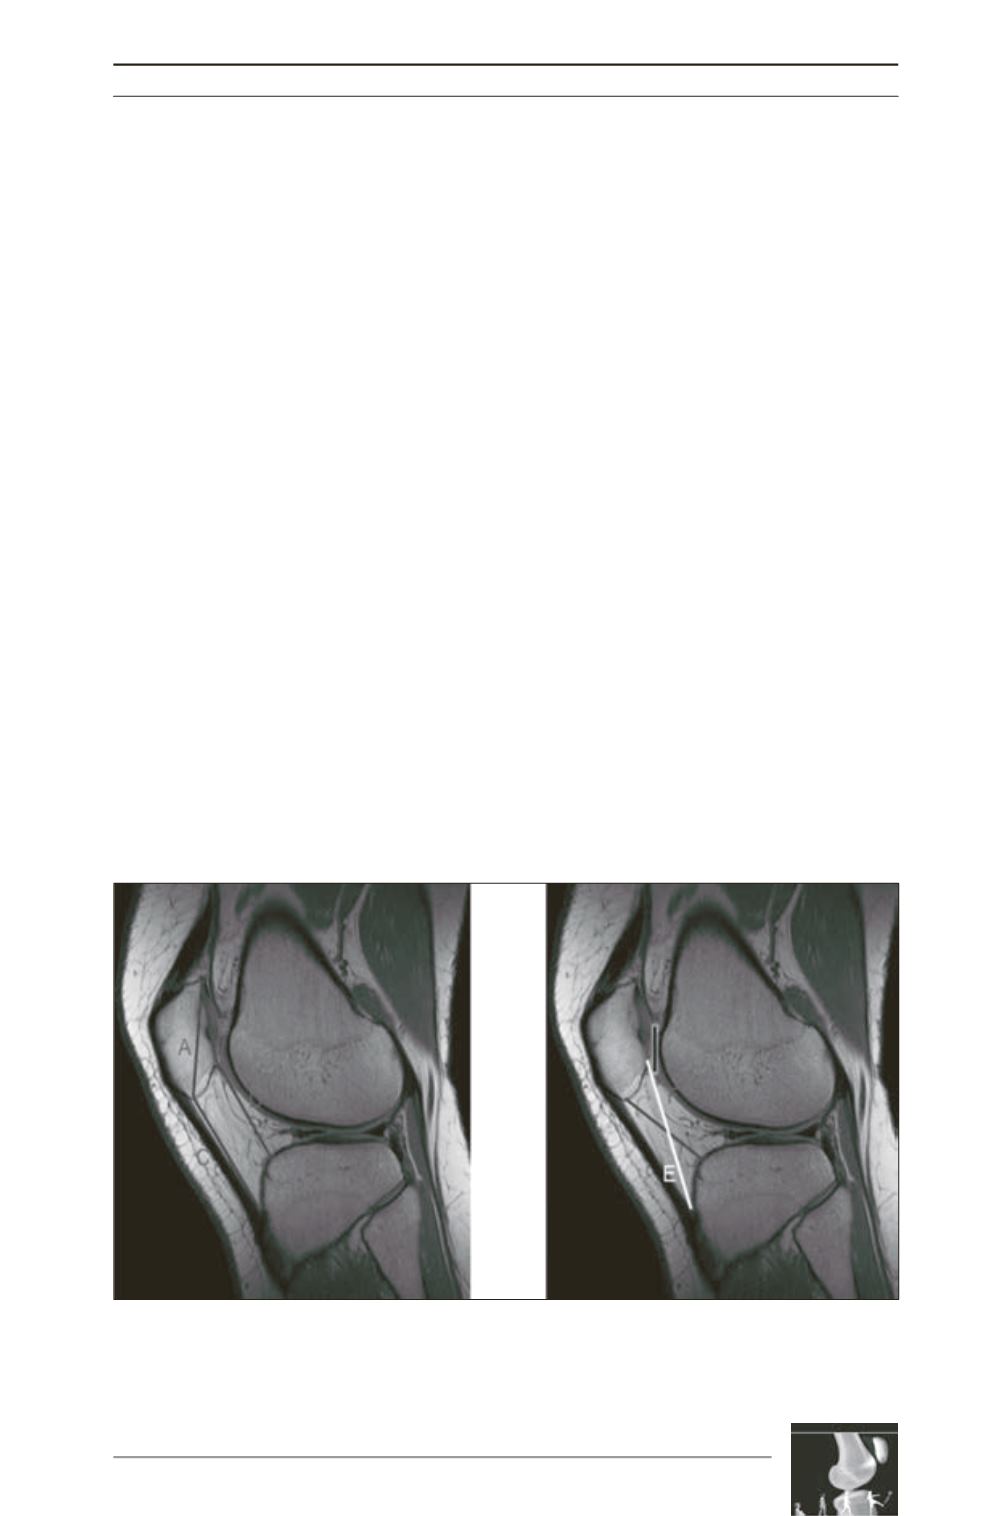
Patellar Station
(fig. 2)
Patellar station has been researched extensively
[1, 5, 8, 9, 20, 25-28], yet our data demonstrated
significance only with the Insall-Salvati Ratio
(Controls 1.08±0.02; PFJDs 1.26±0.03; p<.001)
and the Caton-Deschamps Ratio (Controls
1.13±0.02; PFJDs 1.29±0.03; p<.001). The
remaining measurements lacked both non-
overlapping confidence intervals and p values
<0.05.
Trochlear Morphology
(fig. 3)
Numerous measurements of trochlear
morphology were significant at the proximal
and distal trochlea. At the proximal trochlea (1
st
Cut) significant measurement included classic
measurements like Sulcus Angle (Controls
148.48°±0.94; PFJDs 165.57°±2.65; p<.001)
and Lateral Trochlear Inclination (Controls
21.27°±0.66; PFJDs 13.31°±1.36; p<.001). But
lesser knownmeasurements likeETIT(Controls
1.51±0.05; PFJDs 2.11±0.17; p<.001), which is
a measurement of facet asymmetry, were also
found to be significant. Lateral Condylar Height
(LCH), Central Condylar Height as percentage
of epicondylar width (% CCH), Medial
Condylar Height (MCH) and Medial Condylar
Height as percentage of epicondylar width (%
MCH) were found to be significant at the
proximal trochlea. The medial condylar height
was significant in the distal trochlea.
Measurements at the distal trochlea were more
likely to demonstrate significance, though the
difference between the means was often larger
at the proximal trochlea. Interestingly, Lateral
Condylar Height lost significance at the distal
trochlea (p=0.643). Also worth noting is that
while all initial condylar height measurements
lacked significance at the distal trochlea, when
adjusted for epicondylar width they all proved
significant. For example, LCH as a percent of
epicondylar width had a mean of 81%±1 for
Controls and 88%±1 for PFJDs. Transepicon
dylar width demonstrates significant difference
between groups (Controls 71.00mm±0.76;
PFJDs 75.23mm±0.95; p<.001). The Trochlear
Groove Thickness was not significant at either
point along the trochlea
(fig. 4).
Fig. 2: Patellar Station
Insall-Salvati = C/A Modified Insall = E/B Articular Overlap Canton-Deschamps = D/B
Morphology Ratio = B/A PF Contact Surface Ratio = B/Articular Overlap


