
S. LUSTIG, A. ELMANSORI, T. LORDING, E. SERVIEN, P. NEYRET
162
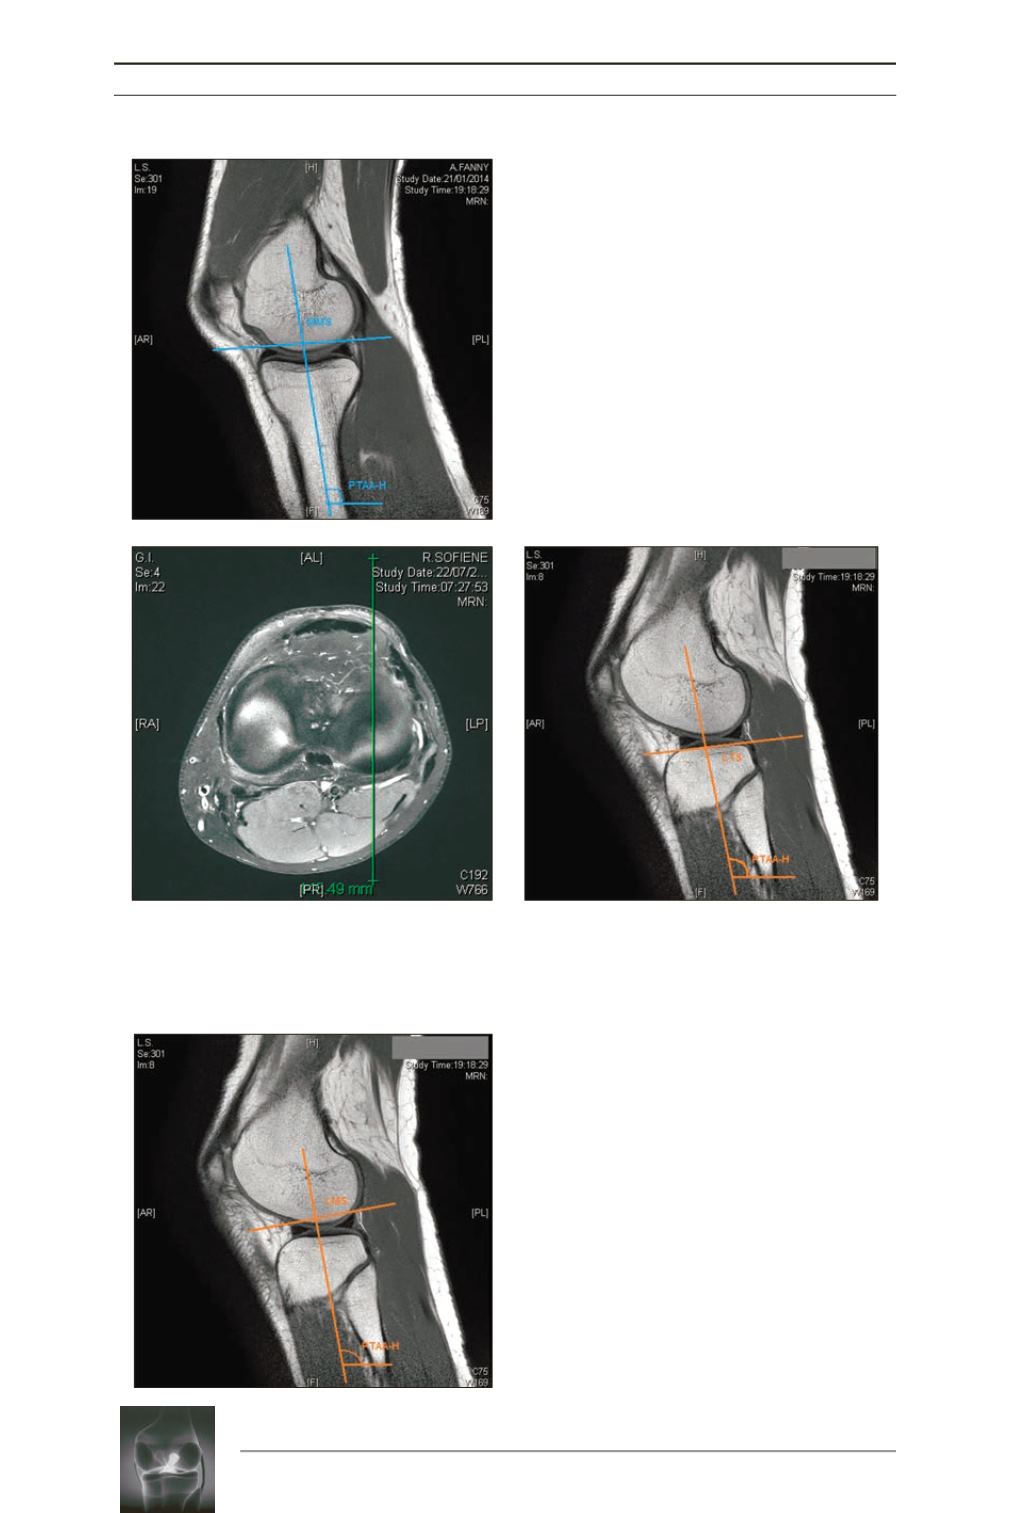
Fig. 5:
After superimposition of the PTTA by
means of the PTAA-H, the MMS was calculated
as the angle between tangent line to the highest
points in the anterior and posterior region of the
medial meniscus and perpendicular line to the
tibial axis.
Fig. 8:
After superimposition of the PTTA by
means of the PTAA-H, the LMS was calculated
as the angle between tangent line to the highest
points in the anterior and posterior region of the
lateral meniscus and perpendicular line to the
tibial axis.
Fig. 6, 7:
The sagittal image was chosen from the axial cut at the joint line in mid-lateral cut and the
PTAA was superimposed on the selected image by means of the PTAA-H angle. The LTS was
calculated as the angle between tangent line to the high points of anterior & posterior region of the
lateral tibial plateau and a perpendicular line to the tibial axis.


