
TIBIAL SLOPE AND ACL RUPTURE: MRI ASSESSMENT
161
All measurements of the tibial bony slopes and
meniscal slopes angles were carried out by
using the annotation tools on the digital Picture
Archiving and Communication System (PACS)
provided by the hospital. For a given
measurement, the maximum deviation from
the actual value does not exceed 0.5°. Proton
density sagittal sections of the MRIs were
selected to measure the angles.
All the MRIs were obtained from a single 1.5-T
MRI scanner (manufacturer-supplied quadra
ture head coil, Philips Medical Systems). We
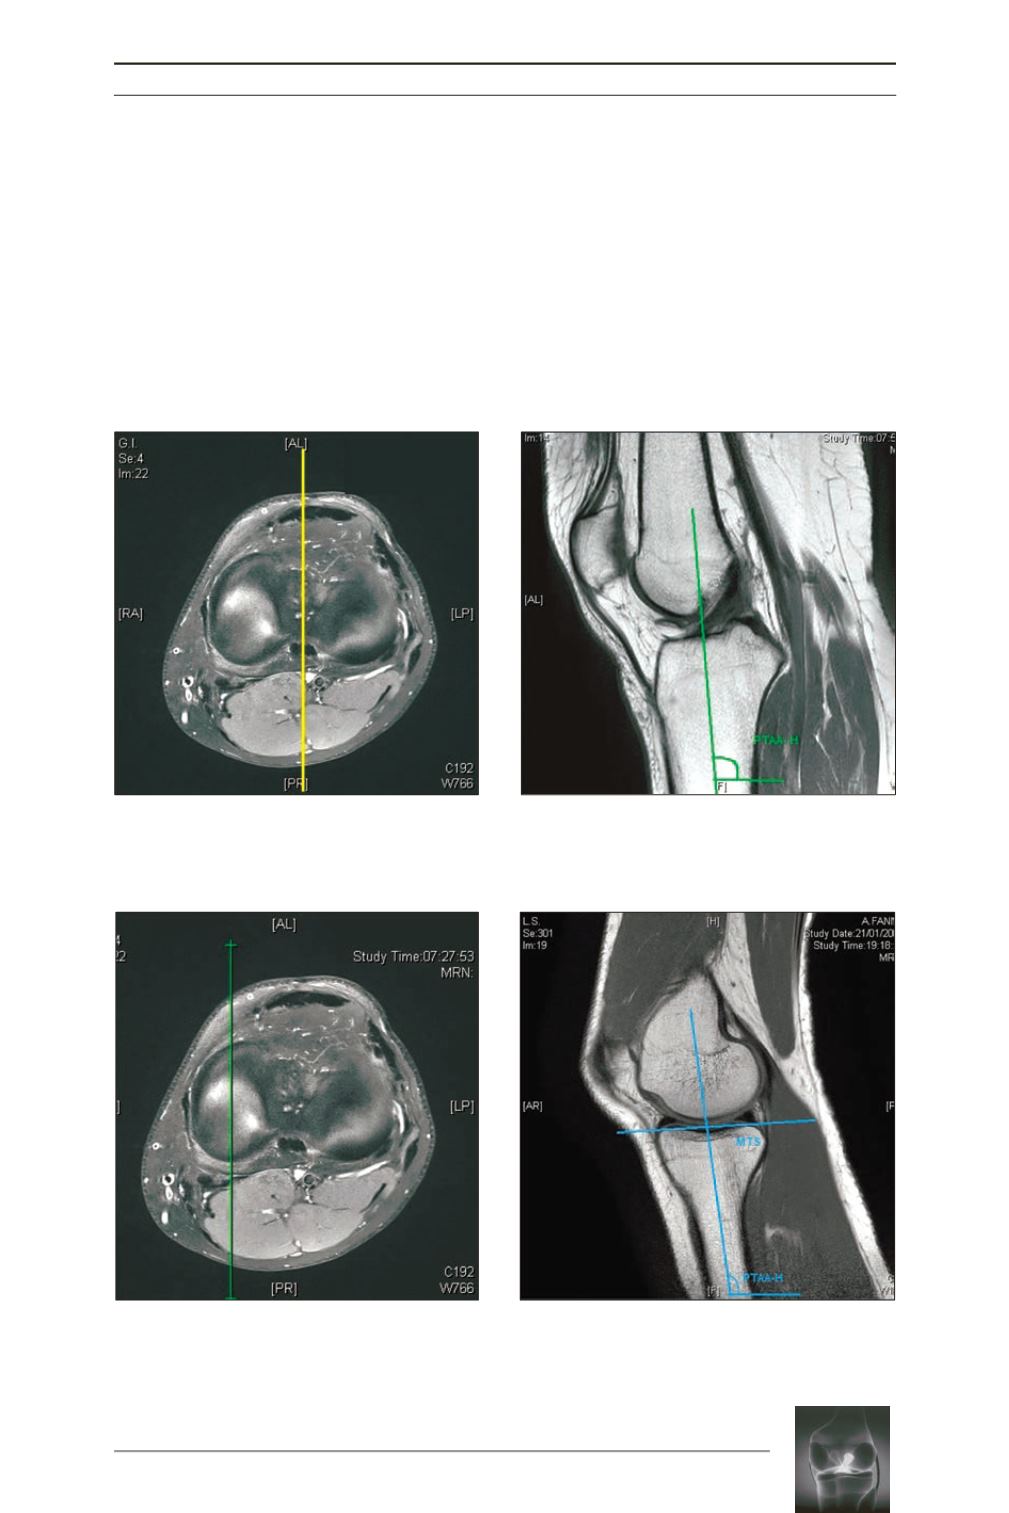
chose three sagittal images from the
corresponding axial cuts at the joint line for
3 different cut regions: the mid-sagittal cut
(fig. 1, 2), the mid-medial tibial plateau cut
(MTP) (fig. 3, 4, 5) and the mid-lateral tibial
plateau cut (LTP) (fig. 6, 7, 8).
Fig. 1, 2:
The sagittal image was chosen from the axial cut at the joint line in midsagittal cut. The PTTA was
calculated by a line bisecting the midpoint distances between the two tibial cortices at the level of tibial
tuberosity and 5cm below. The angle between the PTAA and the horizontal was also calculated PTAA-H.
Fig. 3, 4:
The sagittal image was chosen from the axial cut at the joint line in mid-medial cut and the PTAA
was superimposed on the selected image by means of the PTAA-H angle. The MTS was calculated as the
angle between tangent line to the high points of anterior & posterior region of the medial tibial plateau and
a perpendicular line to the tibial axis.


