
S. LUSTIG, A. ELMANSORI, T. LORDING, E. SERVIEN, P. NEYRET
164
The means and standard deviations (
SD
) for
the repeated measurements of lateral tibial
slope (
LTS)
, lateral tibial slope (
MTS
), the
medial meniscal slope (
MMS
), and lateral
meniscal slope (
LMS
) for the examined group
are shown in the table 2, and those for the
control group are shown in table 2.
For the ACL injury group the LTS ranged from
15.85° to 4.1° and the MTS ranged from 16° to
1.4° while the MMS ranged from 14.5° to
-2.25° and the LMS ranged from 13.85° to
-5.65°. Similarly, for the control group the LTS
ranged from 15.45° to 0°, and the MTS ranged
from 15.05° to -0.6° while the MMS ranged
from 11.55° to -4.25° and the LMS ranged
from 12.65° to -12.5°.
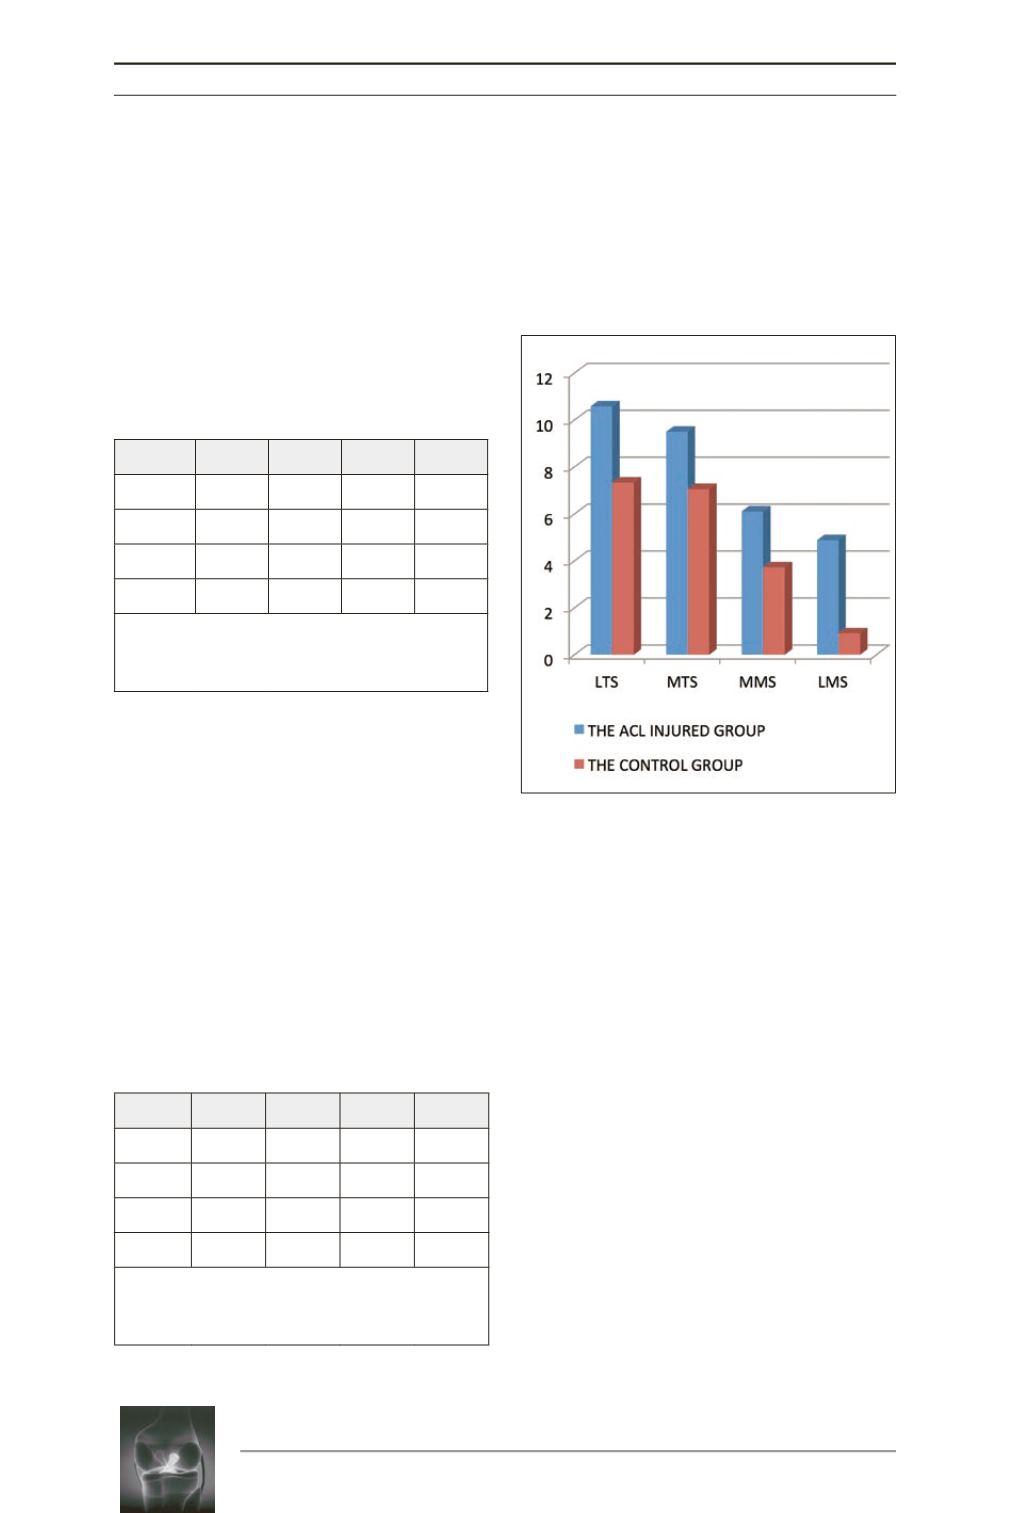
In the analysis of the ACL injury group the LTS
was larger than the MTS but the LMS was
smaller than MMS. In the control group, the
LTS was also larger than the MTS and the LMS
was smaller than MMS (Chart 1).
Comparison of the variants between
examined and control groups
Independent
t
-test was used to compare the
four variants between the two groups, where
the difference is judged to be statistically
significant when
p
=0.05 or less.
By direct comparison between the two groups
using independent
t
-test, the MTS & LTS were
significantly larger in the ACL injury group
than the control (
p
≤0.0001). Similarly, the
MMS & LMS were significantly greater in the
ACL injury group than the control (
p
≤0.0001)
(table 4).
Table 2:
Measurements of the ACL injury group
n=100.
VALUE LTS MTS MMS LMS
MEAN 10.48 9.47 6.06 4.76
SD 3.15 3.34 3.49 4.74
MAX 15.85 16 14.5 13.85
MIN 1.9 1.4 -2.25 -5.65
LTS:
Lateral tibial slope,
MTS:
Medial tibial
slope,
MMS:
Medial meniscal slope,
LMS:
Lateral meniscal slope.
Table 3:
Measurements of control group n=100.
VALUE LTS MTS MMS LMS
MEAN 7.33 7.05 3.72 0.91
SD 3.45 3.72 3.68 4.85
MAX 15.45 15.05 11.55 12.65
MIN 0
-0.6 -4.25 -12.5
LTS:
Lateral tibial slope,
MTS:
Medial tibial
slope,
MMS:
Medial meniscal slope,
LMS:
Lateral meniscal slope.
Chart 1:
Comparison of the means different
parameters between the ACL group and the
control group, measurements are in millimeter.
LTS
: Lateral tibial slope,
MTS
: Medial tibial slope,
MMS
: Medial meniscal slope,
LMS
: Lateral
meniscal slope.


