
A. SONI, V. MUSAHL
64
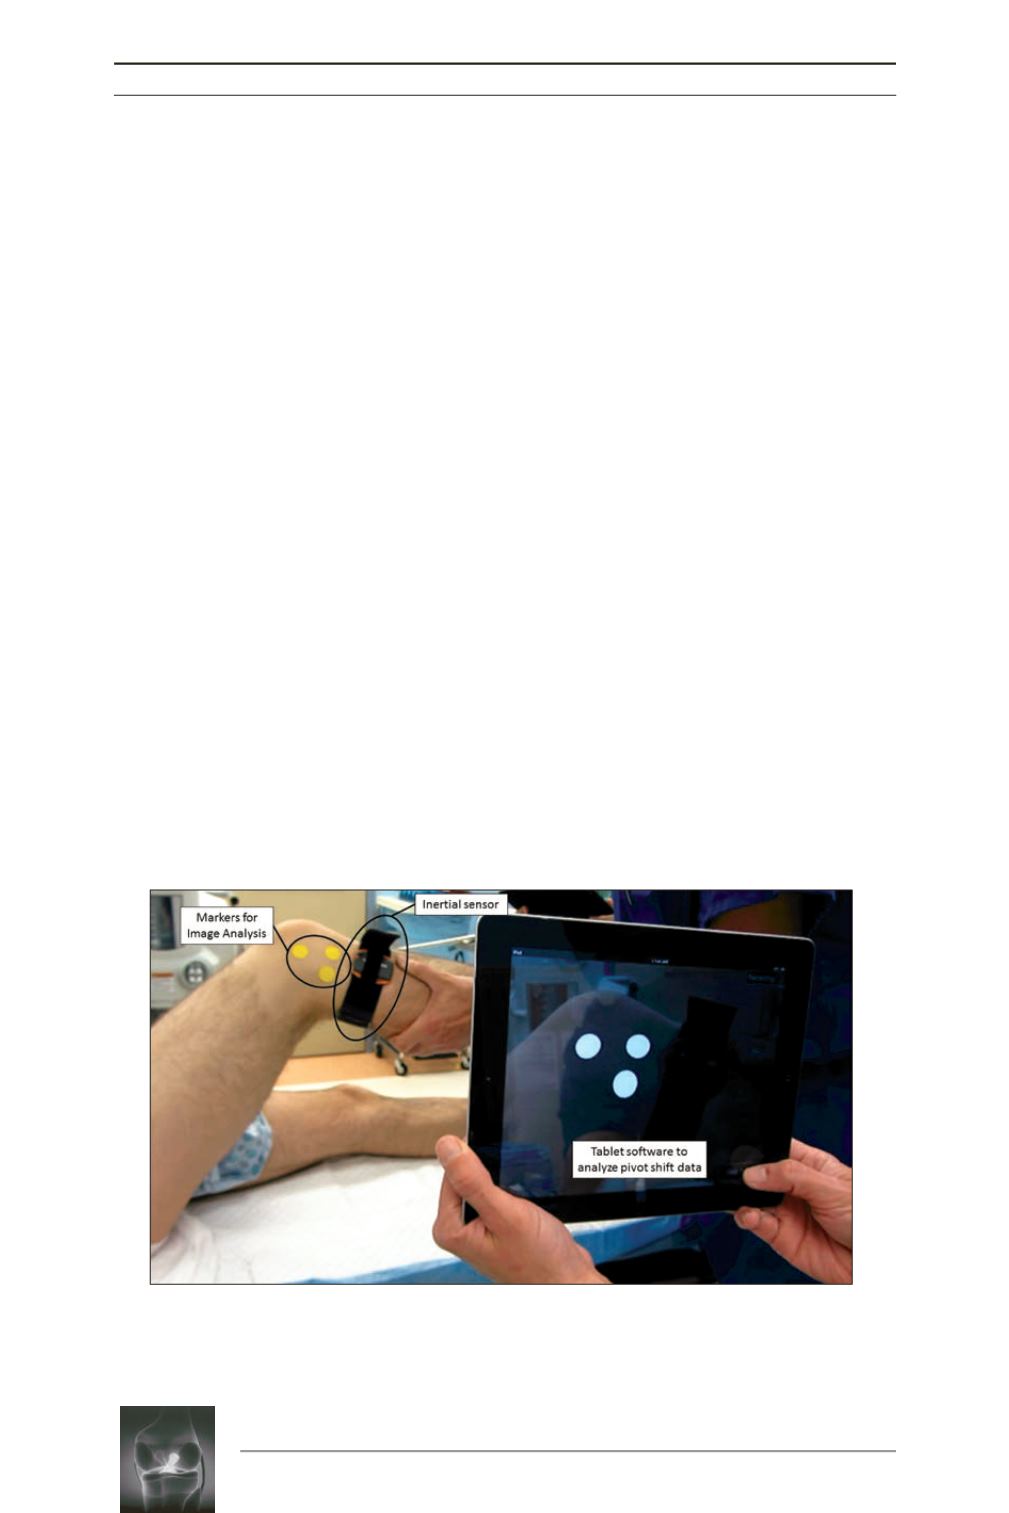
(fig. 2). The skin markers are attached to three
bony landmarks on lateral side of the knee i.e,
lateral epicondyle, Gerdy’s tubercle, and the
fibular head. The software is able to calculate
the relative motion of tibia in relation to femur
by recording and analyzing the video of the
knee motion during pivot shift test. The lateral
compartment translation measured by this
technique has shown to be strongly correlated
with bony motion measured invasively by
electromagnetic tracking system. In distances
less than or equal to 175cm between iPad and
marker position this calculation has less than
6% error, which provides sufficient accuracy
for the clinical set-up. Considering the analysis
time of 10-15 seconds, image analysis
constitutes an easily applicable tool for the
daily clinical work [9].
INERTIAL SENSOR
TECHNOLOGY
The acceleration during the tibial reduction of
the pivot shift is significantly higher in ACL
deficient knees and correlates with the clinical
grading of the pivot shift [7]. Different types of
inertial sensors (accelerometers, gyroscopes,
micro-electromechanical system sensors) have
been used to quantify this acceleration, rotation
and velocity of the bony motion. Similar to the
principle of image analysis, the sensors are
attached to the lateral aspect of the proximal
tibia, close to Gerdy`s tubercle. Transmitting
the gathered acceleration
via
Bluetooth to a
tablet software, named Kira (Orthokey LLC,
Lewes, DE, USA), the data is subsequently
analyzed, plotted and saved in a patient data
base (fig. 3). The applicability and reliability of
this technology was demonstrated in laboratory
setting as well as in the clinical use [10].
Together these devices provide comprehensive
insight to joint rotatory laxity.
During a test, the tablet’s camera records the
movement of the markers while the knee is
being examined (fig. 3). The software scans the
images in real time and utilizes custom
algorithms that shade the entire image except
the markers by adjusting the brightness and
contrast. The software then automatically
tracks the movement of the markers and
calculates the translation of the pivot point
defined by the intersection of the line between
markers on the fibular head and Gerdy’s
Fig. 2:
Testing set-up for the quantitative pivot shift measurement by image analysis technology
and inertial sensors. For image analysis technology markers are attached to the bony landmarks
fibular head, Gerdy’s tubercle and femoral epicondyle to quantify lateral compartment
translation. Inertial sensors are utilized to measure the acceleration of the tibia in the reduction
phase of the pivot shift. Both systems use tablet-software to acquire and analysis the data.


