
PIVOT SHIFT TEST: HOW DOES IT WORK
65
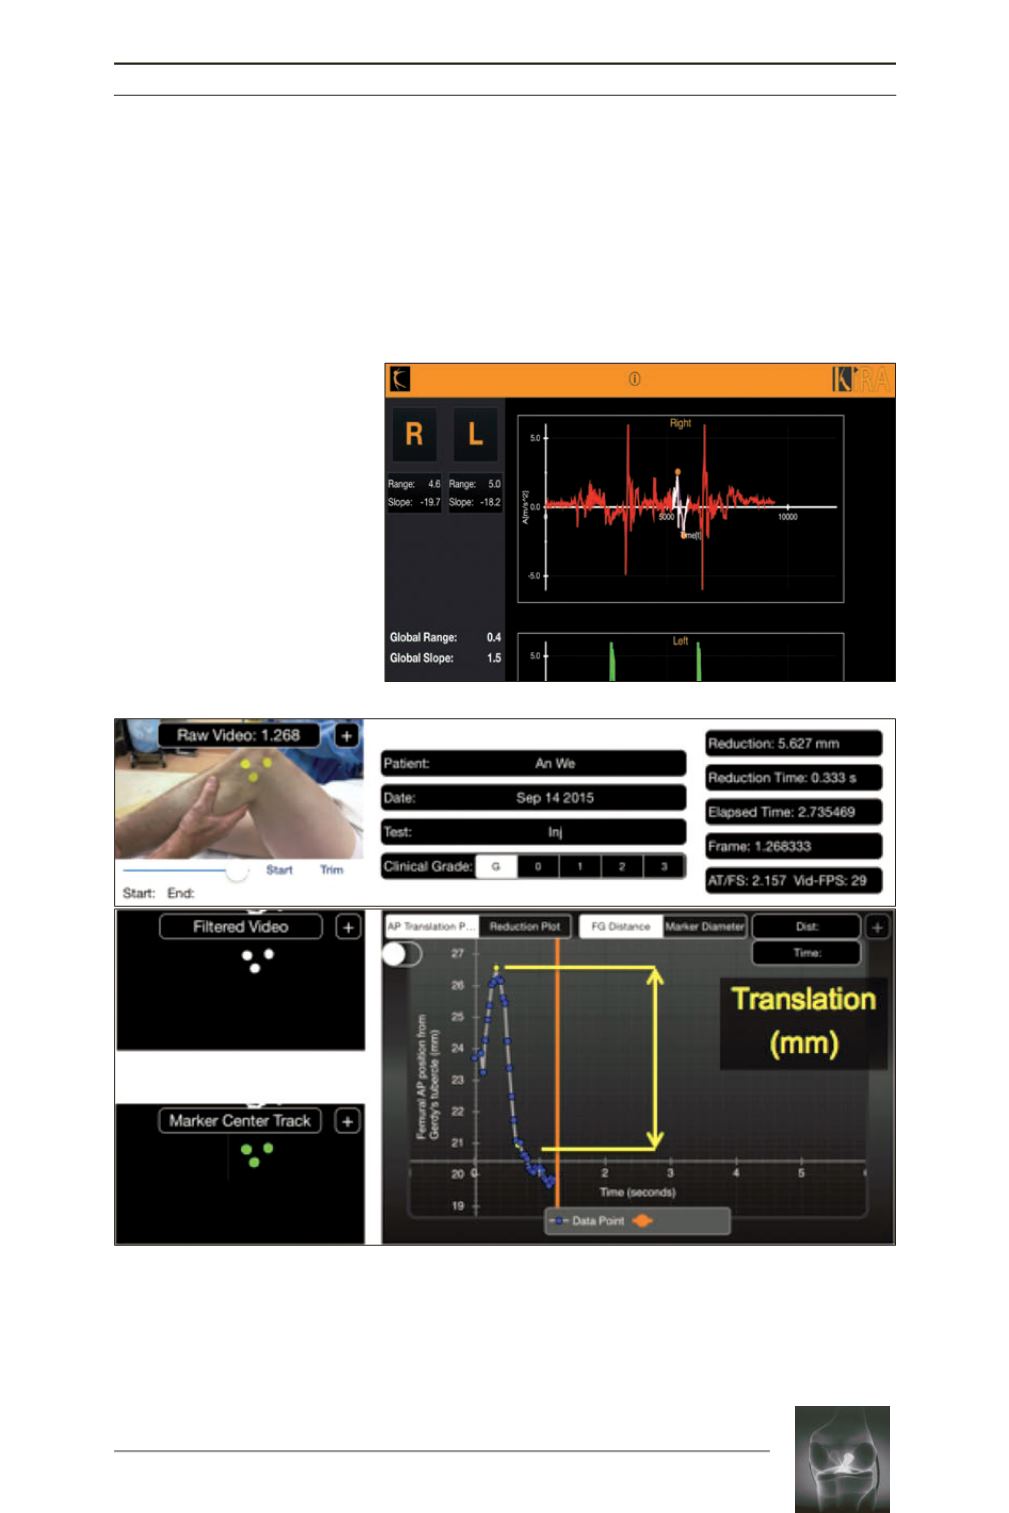
tubercle with a perpendicular line crossing the
femoral condyle marker (fig. 4). After tracking
the markers, the software provides a reduction
plot that represents reduction of the tibia during
pivot shift test. From this plot the amount of
translation can be determined by selecting the
maximum and minimum points of the plot at
the time of the reduction, hence providing us
with a quantifiable number.
These devices provide objective quantification
of rotatory knee instability and avoid second-
Fig. 3:
Screenshot of the Ipad
showing acceleration plot for
right knee during pivot shift
testing, created by Image sensor
technology Kira (Orthokey LLC,
Lewes,
DE,
USA).
White
highlighted part in the curve
shows the points of maximum
and
minimum
acceleration.
Acceleration range is calculated
by subtracting minimum accele
ration from maximum accele
ration. Higher recorded peaks
that occurred after pivot shift
phenomenon are due to the
sudden full extension of the
extremity.
Fig. 4:
Configuration of skin markers and display of software interface for PIVOT application for the I-pad. A
pivot shift test is performed in the photograph on the upper right with skin markers placed on the lateral
femoral condyle, Gerdy’s tubercle, and the fibular head. Tracking of the skin markers as observed on the iPad
interface are shown in the two lower left boxes prior to and during the performance of the pivot shift. The
change in the anterior-posterior position of the femur in relation to Gerdy’s tubercle is recorded as a function
of time as observed in the lower right image. The lateral compartment translation during pivot shift test was
calculated by subtracting the highest and lowest values along the graph, which in this case is 5.627mm.


