
On varus stress, the mean FTA of the groups
was 174.4° ± 3.2°, 175.0° ± 3.0°, 171.2°
± 4.6°, respectively. There was significant dif-
ference between group 1 to group 3 p=0.00
and group 2 to group 3 p=0.00. On valgus
stress, the mean tibiofemoral anatomical angle
of the groups was 179.5° ± 3.0°, 179.0° ± 2.2°,
175.8° ± 3.9°, respectively. Comparisons of
group 1 to group 2 p=1.0, group 1 to group 3
p=0.00 and group 2 to group 3 p=0.00 showed
significant difference (Table 1). The FTA less
than 175.8° on valgus stress was appeared, as
a significant threshold value, to show the varus
deformity was not reducible and to point out
the necessity of a big release on the concave
side of the deformity.
On the varus stress, the mean medial joint
space width of all the patients’ was 1.5
± 1.2 mm and that increased to 5.5 ± 2.2 mm
on valgus stress. There was no difference bet-
ween the groups (p=0.59 and p=0.17). And
lateral joint space width of all the patients’ that
was 8.5 ± 2.3 mm decreased to 6.4 ± 2.0 mm
ARE STRESS X-RAYS USEFUL TO PLANMEDIAL SOFT TISSUE RELEASE PROCEDURES IN TOTAL KNEE ARTHROPLASTY?
15
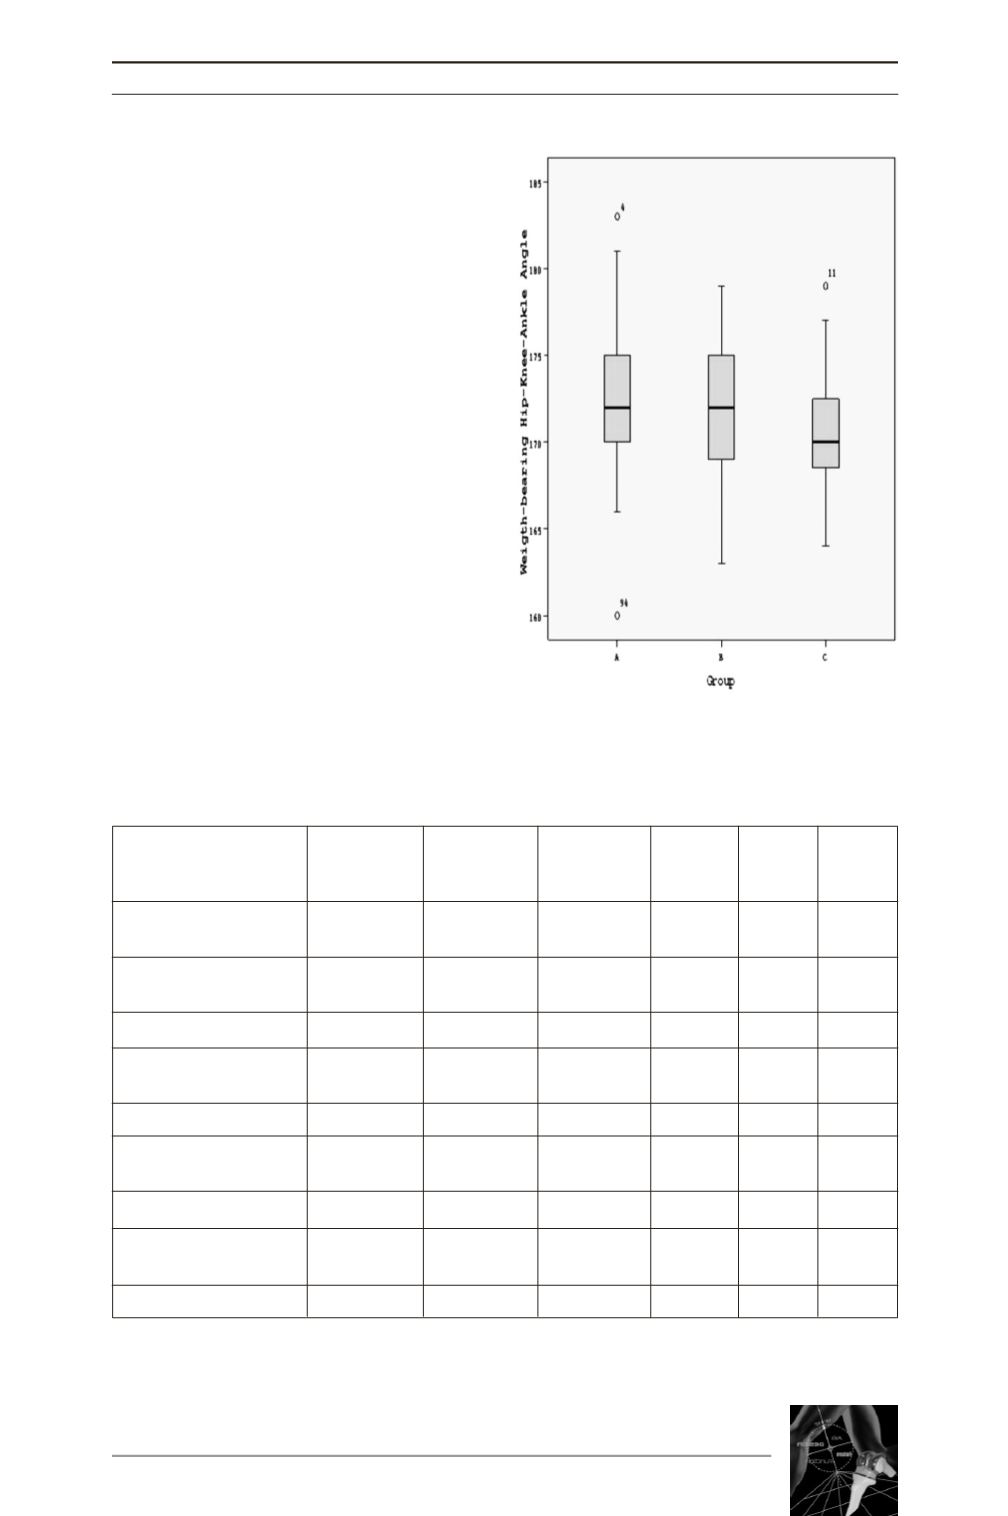
Fig. 6 : Histogram showing the mean values
of HKA between the groups.
Group 1
Group 2 Group 3 Intra-
Intra
P
Table 1
(N=64)
(N=37)
(N=19)
tester
tester value
IVV ICC
HKA lecgabucak
Angle (deg)
172,7
±
4,0
172.1
± 3.9
170.4
± 3.8 0.97
-
NS
FT seperation angle
Varus stress(deg)
6.1
±
2.0
6.0
± 2.2
6.4
± 2.2 0.99
0.95 NS
Valgus stress
0.2
±
2.1
1.2
± 1.6
0.7
± 2.0 0.99
0.94 NS
FT anatomical angle
Varus stress (deg)
174.4 ± 3.2 175.0 ± 3.0 171.2 ± 4.6
0.99
0.94 0.00*
Valgus stress
179.5 ± 3.0 179.0 ± 2.2 175.8 ± 3.9
0.99
0.95 0.00*
Med. joint space width
Varus stress (mm)
1.5
±
1.3
1.4
± 1.2
1.2
± 0.8 0.98
-
NS
Valgus stress
5.7
±
2.3
4.9
± 2.2
5.9
± 2.1 0.99
-
NS
Lat. joint space width
Varus stress (mm)
8.6
±
1.8
8.0
± 2.8
9.4
± 2.8 0.98
-
NS
Valgus stress
6.3
±
1.6
6.2
± 2.2
7.4
± 2.5 0.98
-
NS
Table 1 : Radiographic findings
* Comparison of FTA between the groups was statistically significant;
- For varus stress P (gp A-C) = 0.002, P (gp B-C )= 0.00
- For valgus stress P (gp A-C )= 0.00, P (gp B-C) = 0.001


