
Accuracy of PSI: control with navigation
23
The pre-operative plan and intra-operative
measurements were compared with respect to
femoral (coronal, sagittal and rotation) and
tibial (coronal and slope) alignment. The
process was repeated for cut depths on the
femur (distal medial and distal lateral) and tibia
(medial and lateral plateaus). Normality of the
data was assessed using a Ryan–Joiner test
prior to further analysis. Variables that failed
the test were adjusted by removing outliers
(≤2) until the distribution returned to normality.
Descriptive statistics (mean, standard deviation
and range) were calculated for each variable.
One-sample t-tests were applied to determine if
the mean difference between the planned and
intra-operative
measurements
differed
significantly from zero. The proportion of intra-
operative measurements within ±3° or ±2° of
the plan was also determined. Similar
proportions were calculated for cut depths with
±2mm and ±1mm thresholds. Finally, the
predicted range of values for a single future
measurement, the prediction interval, was
calculated for each variable. The prediction
interval indicates the most likely range of
values within which the difference between the
plan and the intraoperative measurement will
fall for the next future patient and provides an
indication of the between-patient reliability of
the PSCB process. Alpha and confidence
interval were set
a-priori
at 5% and 95%
respectively for the t-tests and 99% confidence
interval was set for the prediction interval.
Post-hoc power analysis identified that the 1-
sample
t
-tests were able to detect minimum
differences ranging between 0.9° and 1.9° from
zero for the alignment measures and 0.57mm
for cut depth with 95% confidence and alpha
set a-priori at 5%. All statistical analyses were
performed using Minitab (version 16, Minitab
Inc, MA, USA).
Results
(fig. 2)
The fitting of the PSCB was adequate in every
case for the femur and tibia. The planned size
matched the surgeon’s decision in 52% and
50% of cases for the femur and tibia,
respectively. In the cases that did not match,
the planned size was a size too small 23.3% of
the time for the tibia and 28.3% of the time for
the femur.
The proportion of differences between the
planned PSCB alignment and the intraoperative
measurements for the femoral block within ±3°
and ±2° was greater for the coronal plane than
in the remaining planes (Table 2). The
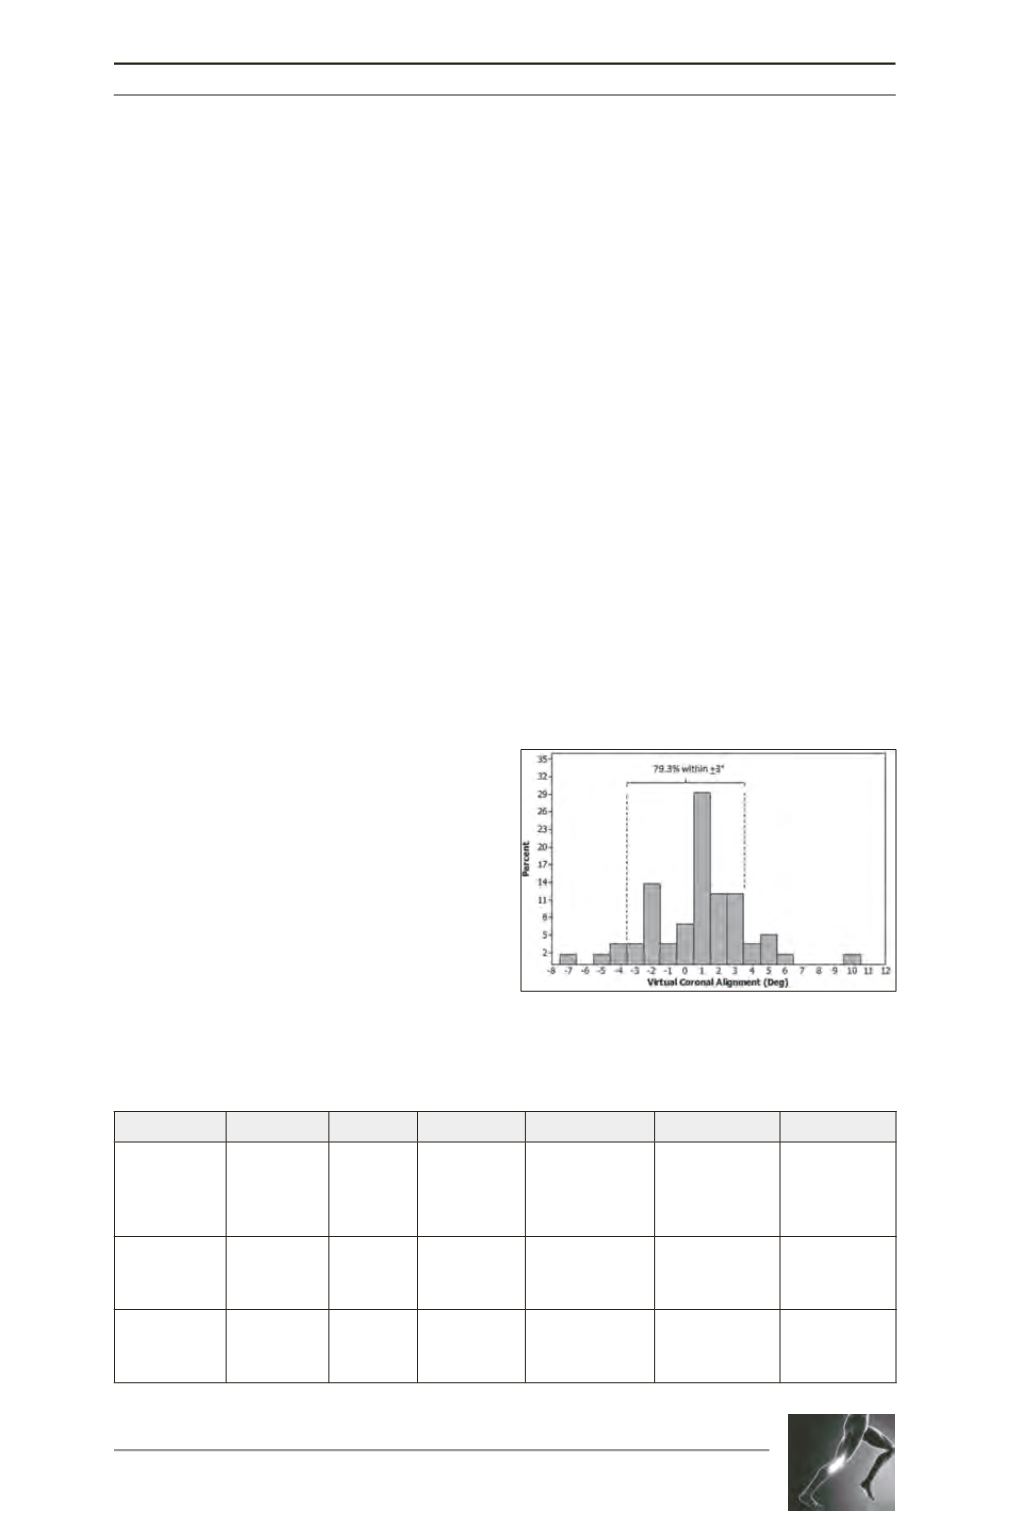
Fig. 2 : Total coronal alignment.
Table 2 : Differences between planned alignment and alignment
recorded from the VISIONAIRE PSCB intraoperatively (°).
Mean P-value Range % within +3° % within +2°
99% PI
Femoral
Coronal
Sagittal
Rotation
-0.2 + 1.8
2.1 + 2.8
0.6 + 2.5
0.41
<0.01
0.09
-4.0, 3.0
-5.0, 9.0
-6.0, 6.5
94.8
65.4
77.2
79.3
49.1
68.4
-4.9, 4.5
-5.5, 9.7
-6.1, 7.3
Tibial
Coronal
Slope
0.6 + 1.9
-0.1 + 2.6
0.02
0.78
-3.0, 10.0
-5.0, 11.0
86.2
80.7
75.9
59.6
-4.4, 5.6
-7.2, 7.0
Total
Coronal
Sagittal
0.6 + 2.9
2.3 + 4.0
0.15
< 0.01
-7.0, 9.5
-5.0, 11.0
79.3
54.5
55.2
32.7
-7.2, 8.3
-8.4, 13.0


