
knee, an Image-processing Software with 3D
reconstruction was used to measure and analyze
our results.
MATERIALS AND
METHODS
We studied post-operative CT scans of 37
knees from 31 females and 6 males. All
patients were implanted with an HLS
Evolution Uni (T
ORNIER
®, St-Ismier, France)
and the lateral [18] or medial [19] compart-
ment. The patients mean height was 162 cm
(SD 8.4; range 147-178) and the mean weight
was 65.4 kg (SD 10.5; range 49-93).
All patients had been scanned by the same
senior radiologist (SC) following an identical
protocol. We designed the protocol specifically
for this study and for this purpose we used a ser-
ried of 10 patients which we excluded from the
final analysis. The CT scans were taken with he
lower limb fixed in a neutral position to avoid
measurement bias. The images were made with
thickness of 1 mm, from the superior margin of
the patella to the anterior tibial tuberosity. In
addition, the scans included images at the hip
and ankle of the operated limb. For 3D analysis
we used image-processing software dedicated to
DICOM images, OsiriX (open-source software;
http://homepage.mac.com/rossetantoine/osirix).
To facilitate 3D analysis we defined a coordi-
nate system with reference to bony landmarks
which described in the literature [14, 16, 26] :
in the frontal plane we used the centers of the
ankle and femoral head, and in the sagittal and
transverse planes we referred to the femoral
epicondyles, posterior condyles, as well as the
middle of the femoral and tibial shafts. The
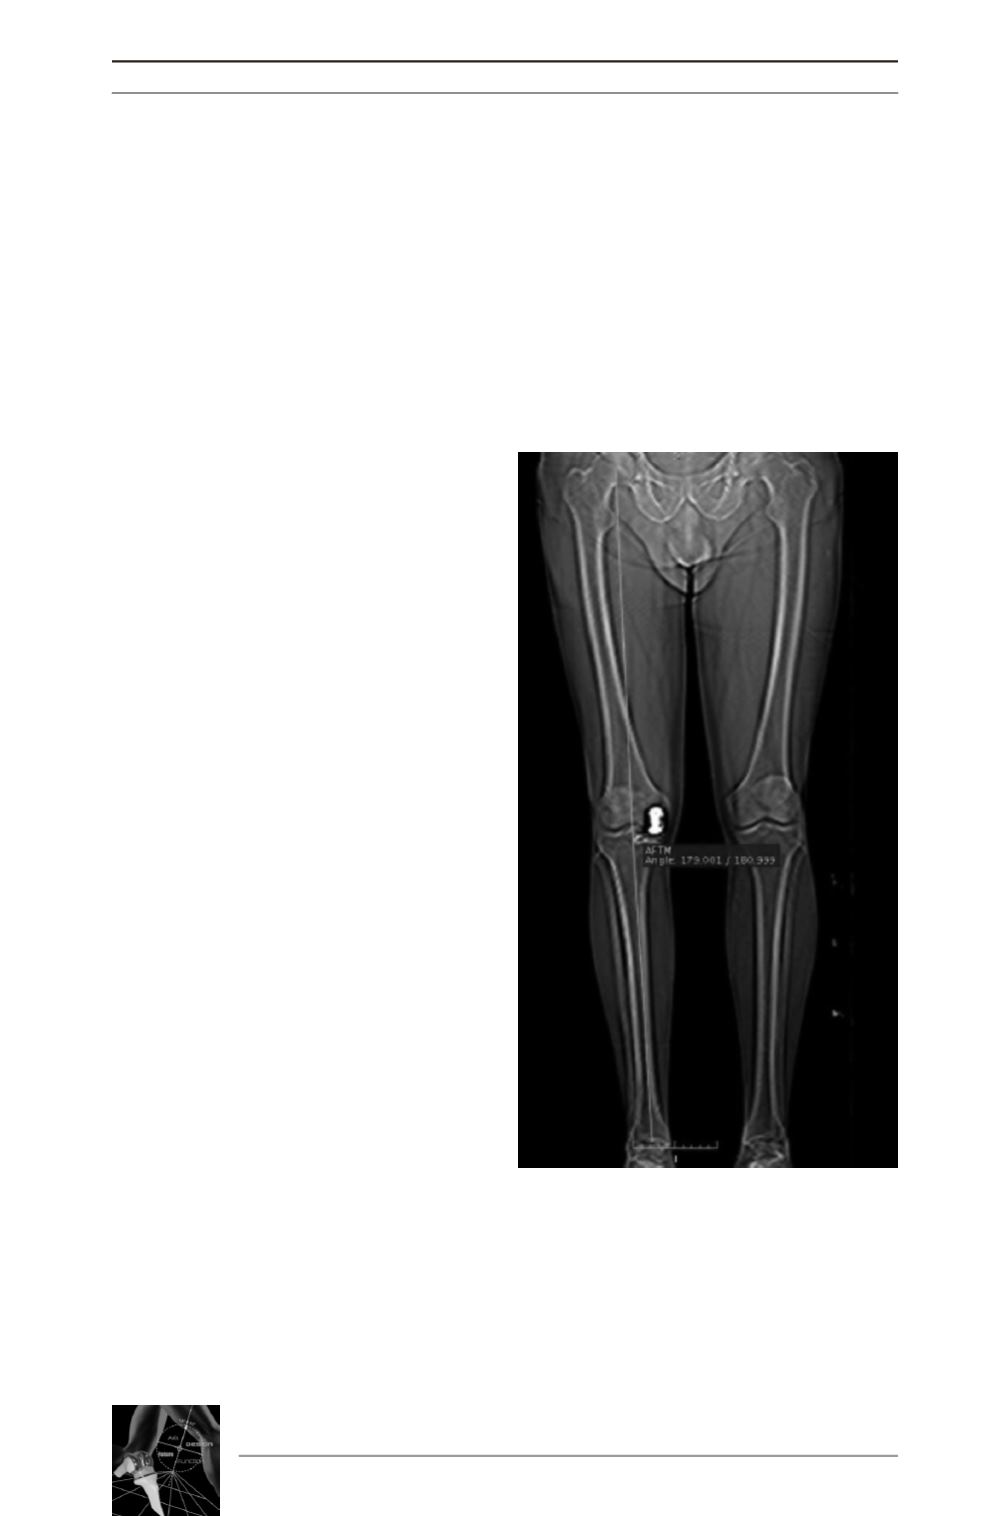
mechanical femoro-tibial angle (mFTA) was
measured on the long leg limbs on the CT-scan
(fig. 1).
Tibial implant positioning was analyzed in the
sagittal plane (tibial slope) and in the frontal
plane with the inclination of the tibial implant
relative to the opposite side. By measuring the
obliquity between the tangent to the healthy
tibial plateau and the tangent to the resurfaced
plateau, we obtained the varus/valgus inclina-
tion of the tibial implant. In the axial plane, the
posterior tibial plateaus were used as anatomi-
cal references to determine the rotation of the
tibial implant (fig. 2). For the femoral implant,
we analyzed the angle between the center of
the femoral shaft and axis of the femoral plug
allowed to measure the rotation of the femoral
implant.
A comparison was performed between the
medial UKA and the lateral UKA.
Statistical analysis was performed by using
Student’s
t
-test and Pearson’s correlation by
14
es
JOURNÉES LYONNAISES DE CHIRURGIE DU GENOU
174
Fig. 1: Long legs film with measurement of
the mechanical femoro-tibial angle.


