
Imaging of Patellofemoral Joint Osteoarthritis
229
“
Biochemical” analysis
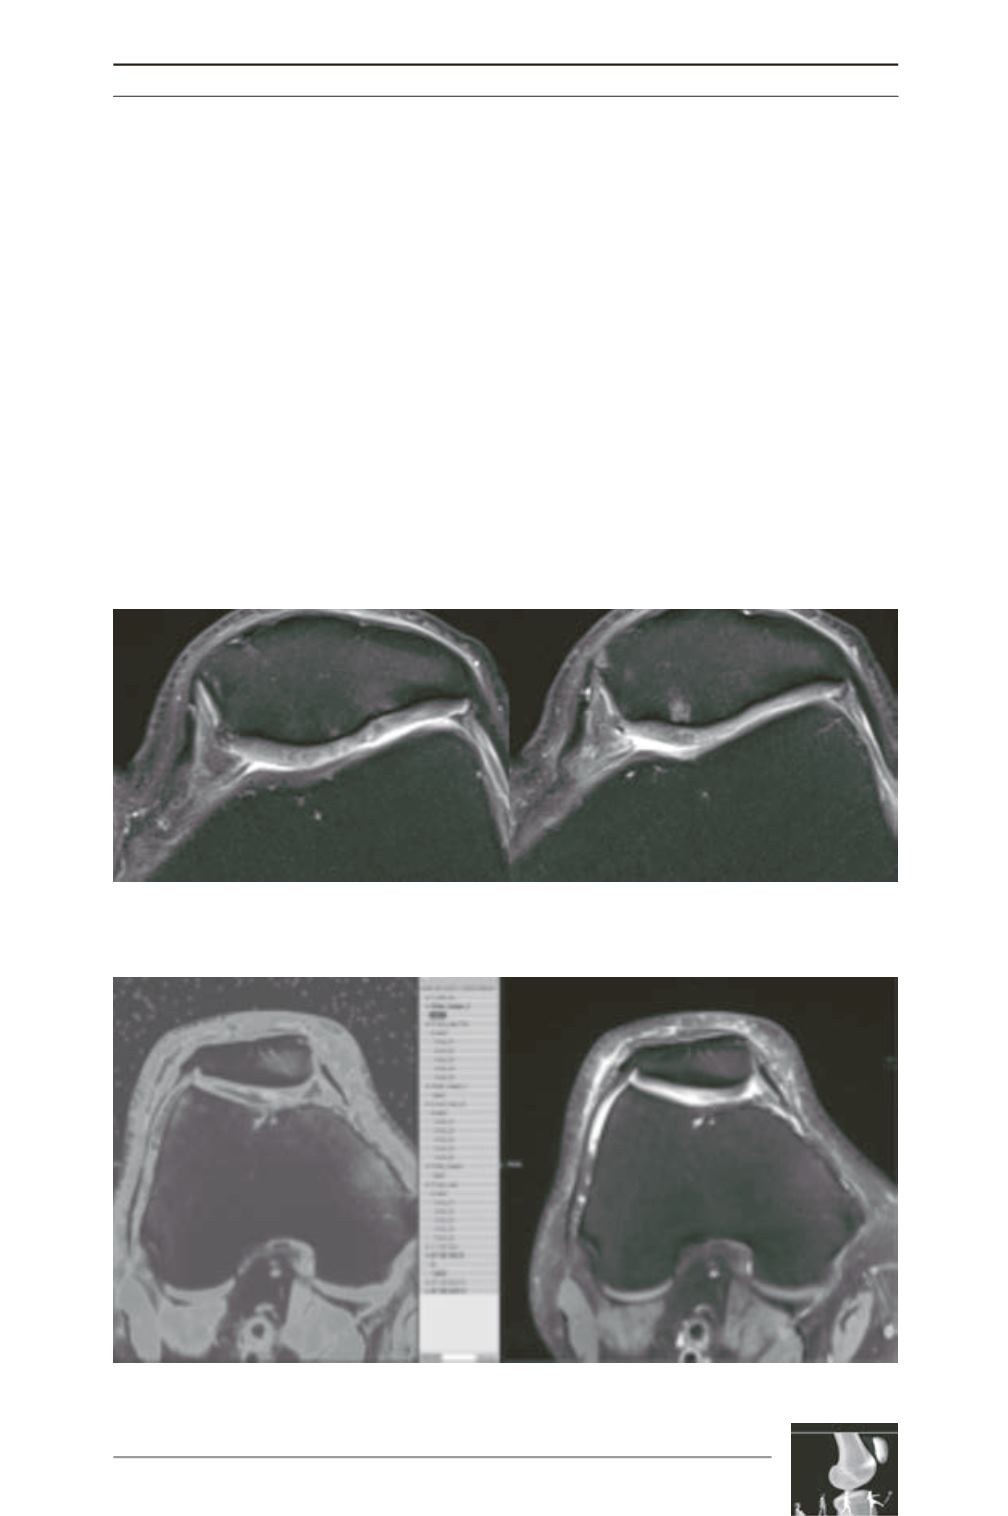
On the views shown above (fig. 8), regular
chondral thinning and signal anomalies within
the cartilage can be noted; there is no deep
chondral erosion [7, 28].
T2 mapping
[29] can be used in current practice;
it consists of a T2 multi-echo sequence of 10
slices of 3-mm thickness. It indirectly provides
information about the extracellular matrix. The
different layers of cartilage are characterized
by their biochemical composition and in
particular their water content which provides
different T2 values for the deep, middle and
upper zones.
Principle of T2 mapping:
- Measurement of T2 relaxation time of the
cartilage at a given level with echo times
(TE).
- T2 relaxation time reflects the ability of
free water to move inside the cartilaginous
matrix.
- Pathological cartilage: decrease in glyco
aminoglycan content, and in size of proteo
glycans, increase in water movement.
- Increase of T2 in pathological cartilage
compared to healthy cartilage.
- Creation of mapping and fused image (fig. 9).
The T2 mapping sequences do not explore
chondral ulcers (fig. 10)
Fig. 8: Proton-density fat saturation (PDFS)
Fig. 9: T2 mapping


